New
Modern platforms usually treat observability as three core signals:
- Metrics
- Logs
- Traces
OpenTelemetry (OTel) is the standard way to produce and ship all three signals.
Monitoring is a process of controlling and management of performance and availability of software applications.
Modern platforms usually treat observability as three core signals:
OpenTelemetry (OTel) is the standard way to produce and ship all three signals.
How many times have we migrated an IRIS Instance to another machine, maybe even another version, and after a few days realized we forgot that one SSL Configuration critical for a Business Operations to work? Or maybe a credential, or a lonely class in a package by itself?
The simple solution is to make a checklist¹. A checklist of the entities we have to move. But simple checklists on Word documents are often forgotten, or just ignored.
There are nfs disk commands (including nfsiostat) included with SystemPerformance, but disabled by default. Enable them by running:
$$Enablenfs^SystemPerformance()
Doing so will add the following nfs commands, for example, on Linux:
/usr/sbin/nfsstat -cn/usr/sbin/nfsiostat [interval] [count]Ensure the commands are installed and runnable from the OS :)
This can be subsequently disabled via $$Disablenfs^SystemPerformance()
Adding an arbitrary OS tool creates a "user" command under ^IRIS.
Hello everyone, thanks for reading this question.
I am currently working with Ens.Alerting.ManagedAlert in an interoperability production and I am using the alert suppression mechanism to avoid generating duplicate alerts within a defined time window (for example, 30 minutes).
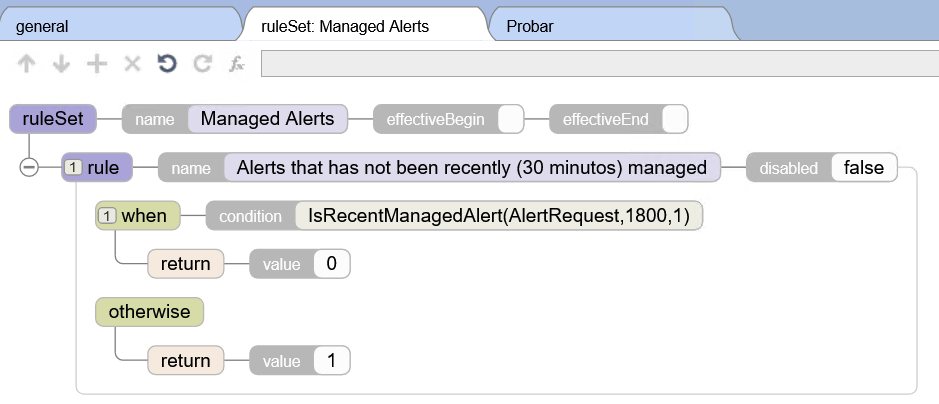
The configuration works correctly in terms of preventing duplicate alerts from being generated, but I have a question regarding observability.
When an alert is suppressed during the configured time window, I can see log messages such as:
"Managed alert not created for AlertRequest with ID 'XXXX' due to rule 'Rules.
1 Introduction
In environments that use InterSystems IRIS, globals are the physical foundation of data storage. Although system queries and administrative tools exist for metric inspection, global growth analysis is usually reactive: the problem is generally only noticed when there is disk pressure or performance impact.
Hello everyone,
I’m looking to implement Continuous Training (CT) as part of an MLOps strategy for some data science projects in IRIS. I want to automate the full cycle:
- Monitoring model performance & accuracy degradation.
- Retraining models automatically.
- Validating and updating production models.
I’ve looked into IntegratedML, but it seems more focused on the SQL interface for training (AutoML). Even with the new Custom Models (beta), which allows for more flexibility with Python, it doesn't seem to provide the "Continuous" orchestration out of the box.
I’d like to know:
.png)
IRIS makes SIEM systems integration simple with Structured Logging and Pipes!
This is an excellent candidate for a developer community post (like Dev.to, Medium, or the InterSystems Community). It bridges the gap between high-level architecture and hands-on implementation.
Here is the summarized article format.
As applications scale, handling heavy computational tasks synchronously becomes a bottleneck. Whether it's processing large data sets, sending high-volume emails, or managing API integrations, a decoupled architecture is essential.
Hey everyone,
I'm just seeking some guidance and confirmation on what I'm doing for my production health monitoring.
We utilize Grafana to have reporting/monitoring dashboards and I have made a REST API to query the health of our productions. I believe I have everything figured out except for one thing that I'm uncertain about and that is the Production Item Color indicators:
.png)
Is there an easy way of being able to figure out the status of an item with the legend above? Ideally, I'd like to have this data in my JSON response.
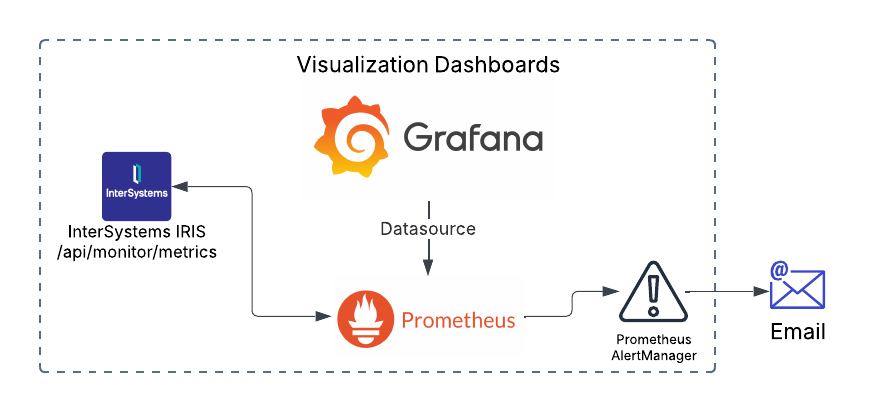
Monitoring your IRIS deployment is crucial. With the deprecation of System Alert and Monitoring (SAM), a modern, scalable solution is necessary for real-time insights, early issue detection, and operational efficiency. This guide covers setting up Prometheus and Grafana in Kubernetes to monitor InterSystems IRIS effectively.
This guide assumes you already have an IRIS cluster deployed using the InterSystems Kubernetes Operator (IKO), which simplifies deployment, integration and mangement.
I am experimenting with OpenTelemetry and recently connected all IRIS instances to telemetry servers.
I'm not interested in emitting custom metrics since IRIS does it fine, regarding tracing - we can use %Trace classes to emit custom traces, but what about logging?
I see that IRIS is able to send system log messages to the OpenTelemetry servers:
{
  "when": "2025-12-10 10:46:25.185",
  "pid": "11852",
  "level": "SEVERE",
  "event": "Generic.Event",
"text": "ISCLOG: CSPServer Error displaying login page $ZE= ns=TEST rtn=%SYS.cspServer .APM normally focuses on the activity of the application but gathering information about system usage gives you important background information that helps understand and manage the performance of your application so I am including the IRIS History Monitor in this series.
In this article I will briefly describe how you start the IRIS or Caché History Monitor to build a record of the system level activity to go with the application activity and performance information you gather. I will also give examples of SQL to access the information.
I was really surprised that such a flexible integration platform with a rich toolset specifically for app connections has no out-of-the-box Enterprise Service Bus solution. Like Apache ServiceMix, Mule ESB, SAP PI/PO, etc, what’s the reason? What do you think? Has this pattern lost its relevance completely nowadays? And everybody moved to message brokers, maybe?
Wiki time: An enterprise service bus (ESB) implements a communication system between mutually interacting software applications in a service-oriented architecture (SOA) .
We are excited to announce the general availability of JediSoft IRISsync®, our new synchronization and comparison solution built on InterSystems IRIS technology. IRISsync makes it easy to synchronize and compare IRIS instances.
IRISsync was voted runner-up in the "Most Likely to Use" category at InterSystems READY 2025 Demos and Drinks.
A huge thanks to everyone who supported us — we’re thrilled to see IRISsync resonating with the InterSystems user community!
IRISsync provides clear visibility into differences between environments.
IAM - InterSystems API Manager is a great tool for monitoring your traffic. If you are trying to use it in your Kubernetes cluster you may have tried doing a deployment similar to this one:
apiVersion: intersystems.com/v1alpha1
kind: IrisCluster
metadata:
  name: iris
spec:
  licenseKeySecret:
    name: iris-key-secret
  configSource:
    name: iris-cpf
  imagePullSecrets:
    - name: intersystems-pull-secret
  topology:
    data:
      image: containers.intersystems.com/intersystems/iris-arm64:2024.1
compatibilityVersion: "2024.1.SUB-AGENT auto stopping

This article outlines the process of utilizing the renowned Jaeger solution for tracing InterSystems IRIS applications. Jaeger is an open-source product for tracking and identifying issues, especially in distributed and microservices environments. This tracing backend that emerged at Uber in 2015 was inspired by Google's Dapper and Twitter's OpenZipkin. It later joined the Cloud Native Computing Foundation (CNCF) as an incubating project in 2017, achieving graduated status in 2019. This guide will demonstrate how to operate the containerized Jaeger solution integrated with IRIS.
Hello InterSystems Community,
I'm working with HealthShare, and need to create a user account for our development environment with specific access requirements.
Hello, good morning, thank you so much for reading this question. ☺️🙂👍
We are developing a code to get information about our Production's items: services, processes and operations.
We know we can get various configurations of a given item: Category, Port, Enabled...
But we wonder how we could get the date time of the last mesage (most recent) received in an item.
To give a code snippet a small section of the code we have developed (and tested), it looks like:
[...]

For i=1:1:tProduction.Items.Count() {
    #dim item as Ens.Config.Item
set item = tProduction.Hello, dear members of our developer community!
In today's article, we're going to take a look at one of the latest remote monitoring features that have been added to the product for our IRIS instances. I'm talking about OpenTelemetry support.
.png)
Hello everyone, let me introduce, one of my latest projects. It is a DataSource plugin for Grafana, which can connect directly to InterSystems IRIS and gather any data (in the future).
.png)
Hi community,
The aim of this article is to explain how to create messaging between IRIS and Microsoft Teams.
In my company, we wanted to monitor error messages, and we used the Ens.Alert class to redirect those error messages through a Business Operation that sent an email.
The problem was that we sent those error messages to a support account where there were many emails. We wanted something specific for a specific team.
So we investigated how to make these messages reach the development team directly and they could have, in real time, a notification of an error in our production.
In our company we use Microsoft Teams as a corporate tool, so we asked ourselves: How could we make these messages reach the IRIS development team?
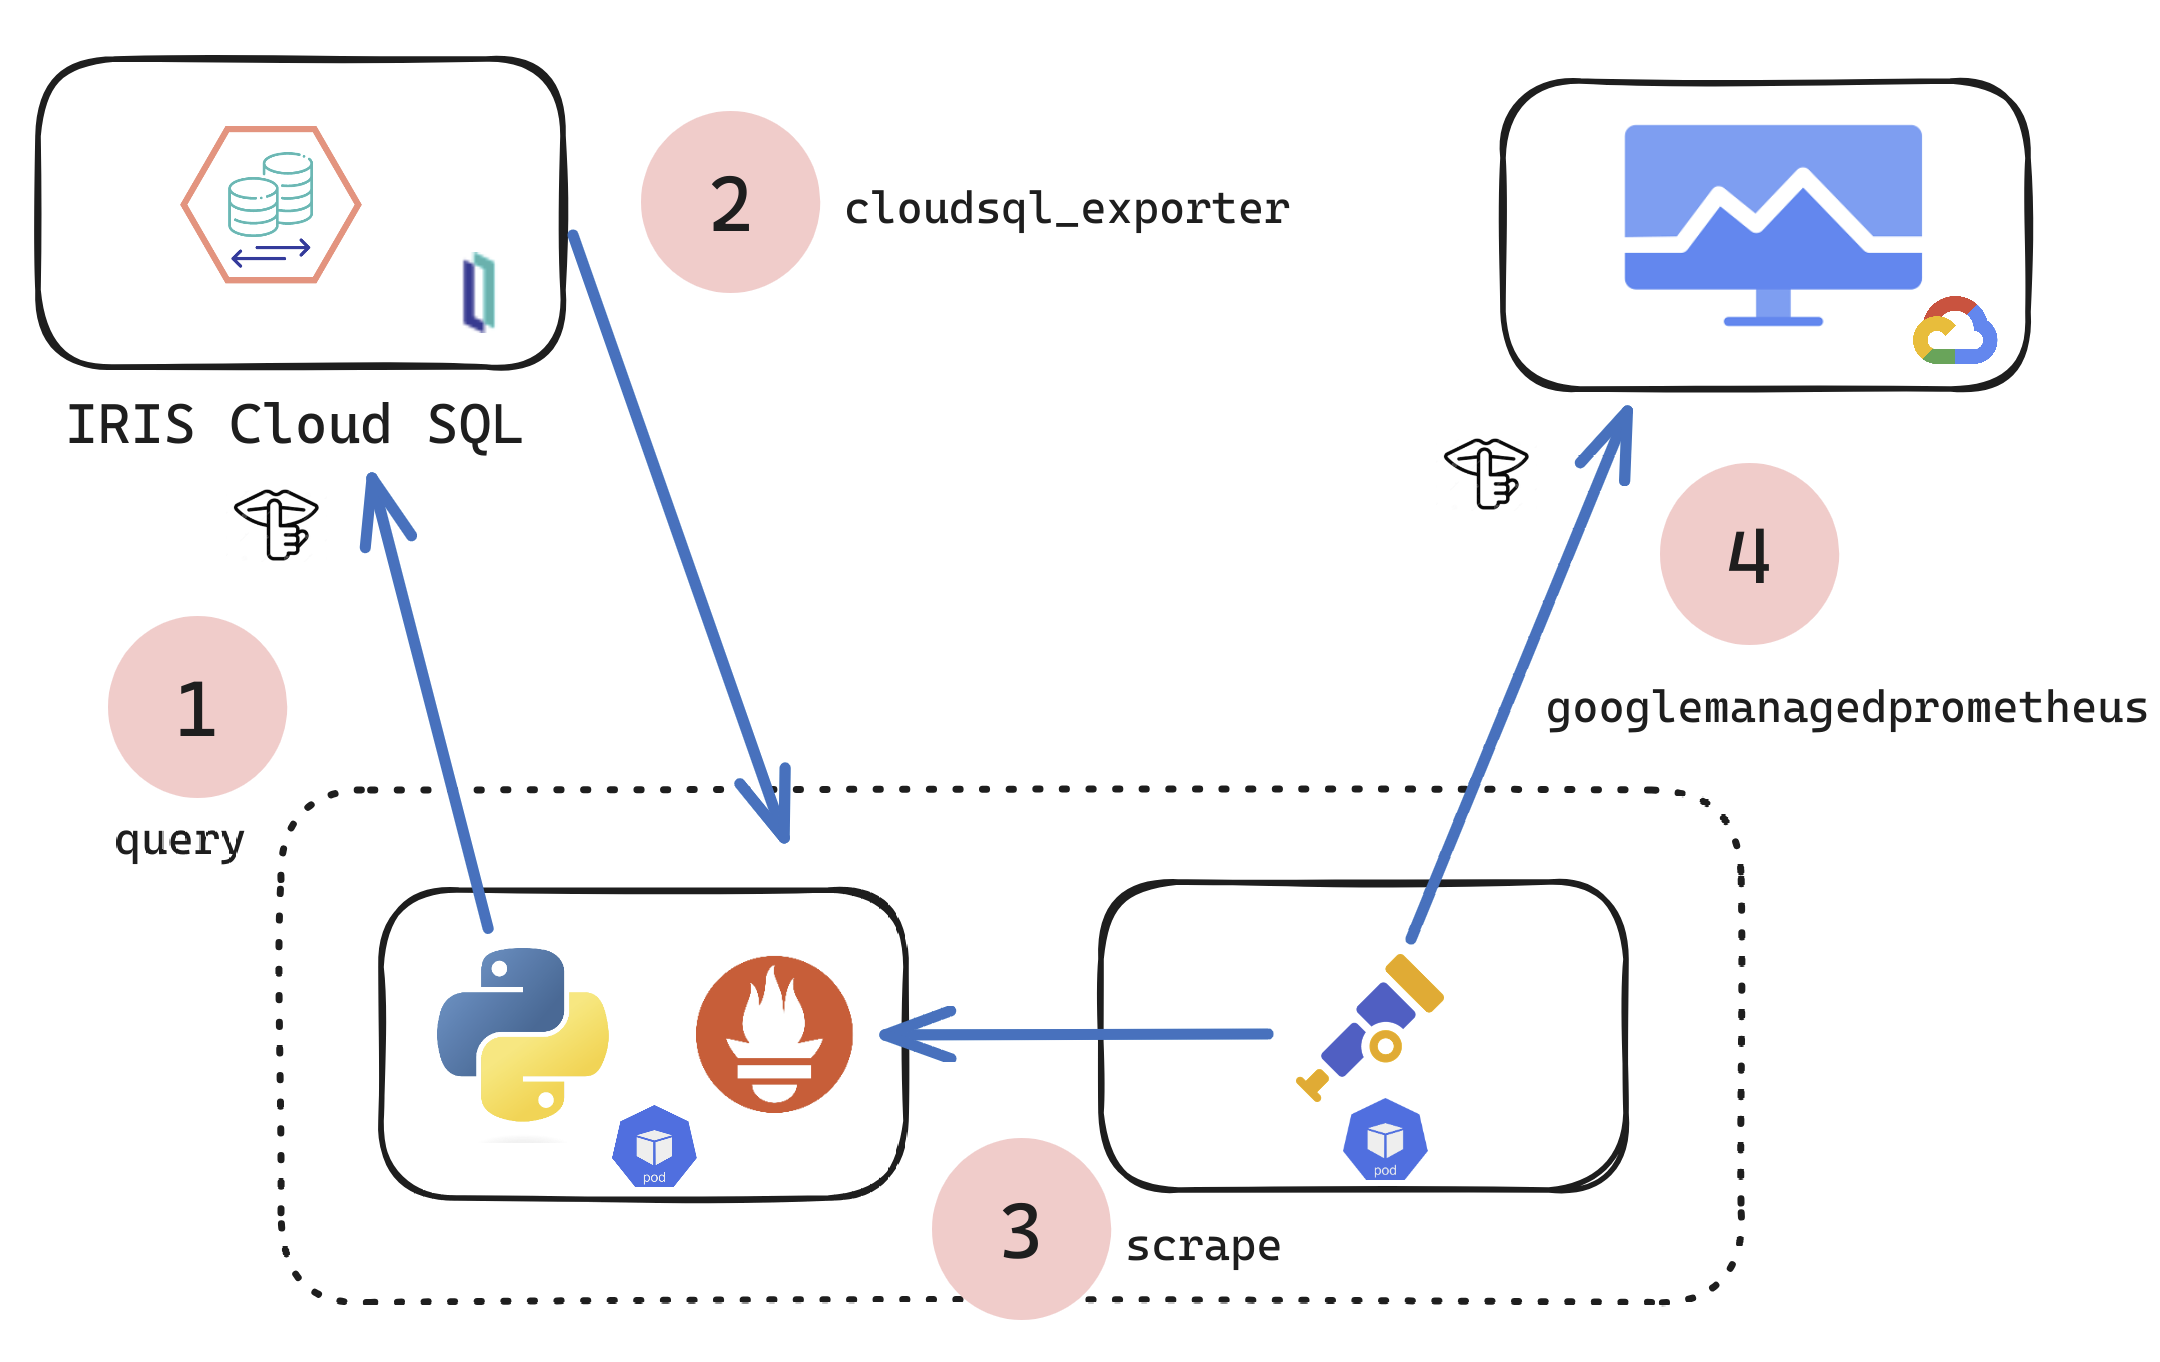
If you are a customer of the new InterSystems IRIS® Cloud SQL and InterSystems IRIS® Cloud IntegratedML® cloud offerings and want access to the metrics of your deployments and send them to your own Observability platform, here is a quick and dirty way to get it done by sending the metrics to Google Cloud Platform Monitoring (formerly StackDriver).

Here were going to take 3 laps of your time and demonstrate how I wired up my Racing SIM to IRIS for "As Real Time as It Gets" Metrics reporting. I missed the window for the contest, which happens quite often, but I still ended up 3rd I think in the demo race in the video below.
Below are the technical ingredients for this demonstration for a salad you can post on Instragram.

Database performance has become a critical success factor in a modern application environment. Therefore identifying and optimizing the most resource-intensive SQL queries is essential for guaranteeing a smooth user experience and maintaining application stability.
This article will explore a quick approach to analyzing SQL query execution statistics on an InterSystems IRIS instance to identify areas for optimization within a macro-application.
Rather than focusing on real-time monitoring, we will set up a system that collects and analyzes statistics pre-calculated by IRIS once an hour. This approach, while not enabling instantaneous monitoring, offers an excellent compromise between the wealth of data available and the simplicity of implementation.
We will use Grafana for data visualization and analysis, InfluxDB for time series storage, and Telegraf for metrics collection. These tools, recognized for their power and flexibility, will allow us to obtain a clear and exploitable view.
More specifically, we will detail the configuration of Telegraf to retrieve statistics. We will also set up the integration with InfluxDB for data storage and analysis, and create customized dashboards in Grafana. This will help us quickly identify queries requiring special attention.
To facilitate the orchestration and deployment of these various components, we will employ Docker.

Hi,
i'm with a trouble to take the api/monitor/alerts using prometheus.
i'm using prometheus 3.2.1 with IRIS 2022.1, the api metrics is working fine, but with the alerts, i'm receiving the following error:
.png)
and this is the answer in the request:.png)
it apears the iris is not using the right way to answer the OpenMetrics the way Prometheus want.
Someone already see this?
I built a monitoring system in Grafana using the IRIS API /api/monitor/metrics (reading with Prometheus) but I noticed that the RAM usage shown was below that shown by the operating system.
I installed the Zabbix agent and the usage values were higher, but with a line with the same highs and lows but shifted.
The metric in the API is iris_phys_mem_percent_used, described as "Percent of physical memory (RAM) currently in use", in Zabbix it is the Item tag: "component: memory" item: "Memory utilization".
.png)
IRIS Health Monitor is part of System Monitor (see here).
The intention is to further process the captured sensor reading in order to identify the "health" of a system by checking the sensor reading values against pre-defined Base, Min and Max absolute values, and alert accordingly. Additionally, instead of absolute values, you can create Charts (which can be different for different periods of a day), that contain a learned minimum and maximum value after a time spent by the system (at least 24 hours) analysing sensor readings.
The sensor readings included in Health Monitor are defined here.
.png)
So if you are following from the previous post or dropping in now, let's segway to the world of eBPF applications and take a look at Parca, which builds on our brief investigation of performance bottlenecks using eBPF, but puts a killer app on top of your cluster to monitor all your iris workloads, continually, cluster wide!
.png)
Continous Profiling with Parca, IRIS Workloads Cluster Wide