The Polymetric Dashboard
> Customizable System Monitoring. ## Introduction The Polymetric Dashboard is a stand-alone module that provides enhanced monitoring tools for a Caché environment. Equipped with over one hundred sensors that monitor key system metrics, a robust REST API, and a modular AngularJS user interface, the Polymetric Dashboard is fully functional out of the box. However, the Polymetric Dashboard is designed to be customizable; any system metric can be monitored by creating a new sensor, and the visualization of collected data can be tailored to specific requirements and purposes. --- ## Goal Monitoring system health is an integral part of providing effective services. Many key system metrics, such as CPU usage and free disk space, are important under all circumstances, but in the diverse environments in which Caché is used additional situational system metrics should be monitored as well. The Polymetric Dashboard makes monitoring these, and any other, metrics quick and intuitive. ### Custom Sensors The infrastructure of the Polymetric Dashboard allows customers to create their own sensors that can monitor any system metric accessible using Caché Object Script. ### Persistent Data The Polymetric Dashboard stores metric data for a four day period. This allows data to be plotted on graphs, trends to be analyzed, and data collected in the past to be visualized. ### REST API A RESTful web service provides access to the Polymetric Dashboard's sensors and their data, creating a loosely coupled relationship of data collection and visualization. Any visualization method capable of making HTTP requests can access the data collected by the Polymetric Dashboard. ### Modular User Interface The user interface of the Polymetric Dashboard is written using AngularJS; its components are encapsulated modules that can be easily customized and used throughout the UI. Thus, it is trivial to set up customized visualization of collected data. --- ## Use ### Download To download the Polymetric Dashboard visit the [InterSystems GitHub Account](https://github.com/intersystems/Polymetric-Dashboard). ### Documentation In-depth documentation of the Polymetric Dashboard can be found on the [InterSystems Product Documentation Website](http://docs.intersystems.com/documentation/GPD/GPD.html). --- ## Feedback If you have questions or comments about the Polymetric Dashboard contact Andreas Dieckow.
Comments
Sounds awesome. Maybe add some screenshots?
Thank you!
Awsome!
Looks neat.
If you try installing this, it may fail depending on where you install from because the directory structure is quite deep.
For me, the install script choked on "C:\Users\username\Downloads\Software\polymetric-dashboard-kit-v0.2.2\dashboard\node_modules\d3\node_modules\jsdom\node_modules\request\node_modules\har-validator\node_modules\is-my-json-valid\node_modules\generate-object-property\node_modules\is-property".
One of the things I often do in lab environments (not production) is to use the Caché ./mgr folder because I know its always going to exist and has the advantage of also being a short relative path for .xml files etc.
If I copied the setup files to <cache instance directory>/mgr/polykit/polykit-v1.0.0
Then in Caché I can use a short relative path:
%SYS>set status = $System.OBJ.Load("./polykit/polykit-v1.0.0/DashboardInstaller.xml", "ck")
I wanted to blast the dashboard out to a bunch of my lab VMs this morning so I used ansible, I put code snippet here in case its useful.
The full post and introduction for using ansible is here; Ansible Post
I admit this is a bit of a hack but shows some useful syntax.
polykit-install.yml
---
### Main Task - instal polymetric dashboard ###
- debug: msg="Start polykit-install.yml"

- name: local path on laptop for tar.gzip of dashboard kit relative to ansible root
  set_fact:
    local_package_path: ./z-packages

- debug:
    msg: "{{ local_package_path }}"

# hack! ASSUME only one instance per host!!!! ~~~~~~~~~~~~~~~~~~~~~~~~~~~~~~~~~~~~~~~ !!!!

- name: get instance name
  shell:
    ccontrol qlist | awk -F '^' '{print $1}'
  register: instance_name

- debug: var=instance_name.stdout

- name: get instance path (add ./mgr )
  shell:
    ccontrol qlist | awk -F '^' '{print $2}'
  register: instance_path

- debug: var=instance_path.stdout

- name: set base path
  set_fact:
    base_path: "{{ instance_path.stdout }}/mgr/polykit"

# hack! ASSUME only one instance per host!!!! ~~~~~~~~~~~~~~~~~~~~~~~~~~~~~~~~~~~~~~~ !!!!


# Create install directory on target
- name: Create install directory
  file:
    dest="{{ base_path }}"
    mode={{ 777 }}
    state=directory

# Copy polykit file to install directory
- name: Copy polykit.tar.gz to install directory
  copy:
    src="{{ local_package_path }}/polykit-v1.0.0.tar.gz"
    dest="{{ base_path }}"
    remote_src=False

# Unarchive
- name: Unarchive polykit database
  unarchive:
    src="{{ base_path }}/polykit-v1.0.0.tar.gz"
    dest="{{ base_path }}"
    creates="{{ base_path }}/polykit-v1.0.0/DashboardInstaller.xml"
    remote_src=yes


# Run installer

# Build text file

- name: build csession file line at a time
  shell:
    echo "set status = \$System.OBJ.Load(\""{{ base_path }}/polykit-v1.0.0/DashboardInstaller.xml"\", \"ck\")" >"{{ base_path }}"/polykit-inst.txt

- shell:
    echo "set status = {{ '#' }}{{ '#' }}class(SYS.Monitor.DashboardInstaller).Install(\""{{ base_path }}/polykit-v1.0.0"\",0)" >> "{{ base_path }}"/polykit-inst.txt

- shell:
    echo "h">>"{{ base_path }}"/polykit-inst.txt

- shell:
    cat "{{ base_path }}"/polykit-inst.txt
  register: polyinst_check
- debug: var=polyinst_check.stdout_lines

- name: Install dashboard
  shell:
    cat "{{ base_path }}/polykit-inst.txt" | csession "{{ instance_name.stdout }}" -U %SYS
  register: polyinst_install
- debug: var=polyinst_install.stdout_lines
Excellent job!
it took me a little while, though, to figure out all dependencies, namely PYTHON that was not mentioned in the github instructions and fresh enough node.js.
But now everything works as expected now.
One wish: please add a button that would navigate back to the System Management Portal or open the dashboard in a new tab/window.
I was caught on PYTHON too! Turns out that I had 3rd, but 2nd was required.
Hi Daniel, its on the bottom right of the screen. You may need to scroll all the way.
Thank you, Murray!
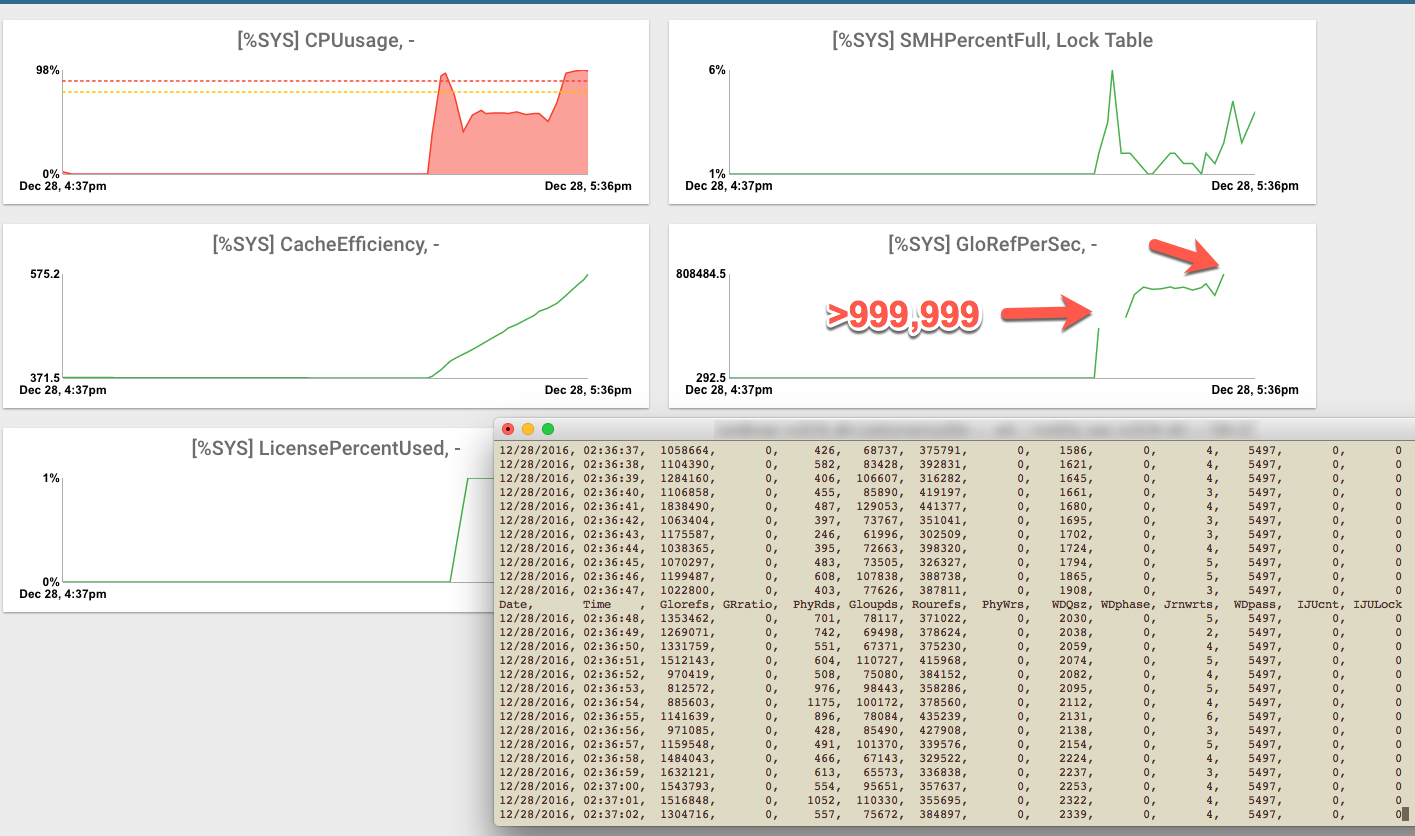
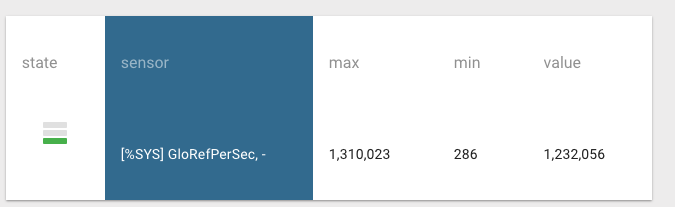
Hi, Great tool - I look forward exploring it further. In the meantime... it appears that chart sensor does not work >1,000,000 e.g. see glorefs/sec. It does show on the sensor display...
Is it a simple fix to increase a graph max value? See the example below,
OK on sensor
Hi,
I'm wondering... Is it possible to have a single dashboard that represents metrics from multiple Cache instances - for example, if I have 3 Cache instances installed on separate servers , and I want to see on a single dashboard, then % license usage graphs from each instance, represented in separate widgets.
Steve
I've been unable to install it.... I didn't find kit.zip for Quick Installation ... at least not in GitHub. I've tried the source installation... I installed Python 2.7 and I'm using node.js 7.0.0.... I guess it should be piece of cake.. but I'm getting errors related to node-gyp rebuild... any ideas?
I too am having a problem installing this.
I'm using the "source installation" instructions.
Can someone verify please what are the true list of prequisites needed (other than Cache 2016.1) for this. Please make no assumptions that node.js, or, Python, of any version, is already installed on the target server..
Thanks - Steve
You need:
- NodeJS
- Python 2
- npm, gyp
- C++ compiler
I needed version 6 (not 7) of NodeJS and had to run
npm install -global --production windows-build-tools
...From an elevated powershell or DOS prompt (running as administrator), to get the UI installed.
Steve
Kit.zip can be found here.
I have installed the PMD and all looks good. I would say that it has been hard to debug my own custom sensors without the ability to throw errors from the GetSensors class, but I got there.
I have found that when the user trying to look at the Poly Metric Dashboard has just the %Operator Role we get an odd problem. The graphs start displaying and then we get a browser "Login pop-up" saying that "(NULL)" has requested the login. When I look at the event trapped by the Audit log I see an illegal attempt to access a protected global...
<PROTECT>GetLanguages+15^%occMessages ^CacheMsg(""),c:\intersystems\cache162b\mgr\
...any ideas which Role or Resource I need to add to this operator?