There are several options how to deliver user interface(UI) for DeepSee BI solutions. The most common approaches are:

  • use native DeepSee Dashboards, get web UI in Zen and deliver it in your web apps.
  • use DeepSee REST API, get and build your own UI widgets and dashboards.

The 1st approach is good because of the possibility to build BI dashboards without coding relatively fast, but you are limited with preset widgets library which is expandable but with a lot of development efforts.

The 2nd provides you the way to use any comprehensive js framework (D3, Highcharts, etc) to visualize your DeepSee data, but you need to code widgets and dashboards on your own.

Today I want to tell you about yet another approach which combines both listed above and provides Angular based web UI for DeepSee Dashboards - DeepSee Web library.

3 16
5 2.2K
Article
· Oct 24, 2016 4m read
DeepSee Troubleshooting Guide

The goal of this “DeepSee Troubleshooting Guide” is to help you track down and fix problems in your DeepSee project.

If the problem can’t be fixed by following the guidelines, you will at least have enough information to submit a WRC issue with DeepSee Support and provide all the evidence to us, so we can continue the investigation together and resolve it faster!

13 16
1 2.5K

Hi colleagues!

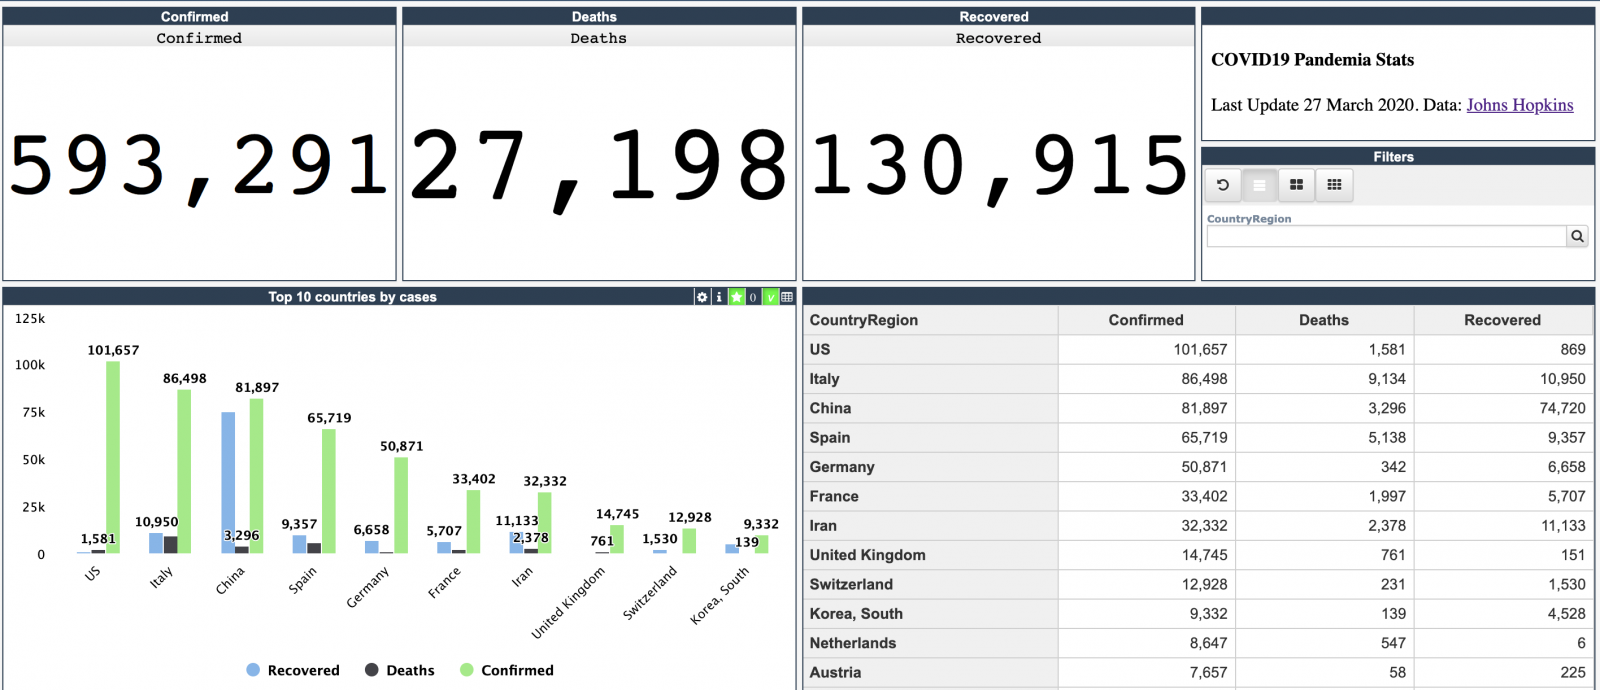
Every day Johns Hopkins University publishes new data on coronavirus COVID-19 pandemic status.

I built a simple InterSystems IRIS Analytics dashboard using InterSystems IRIS Community Edition in docker deployed on GCP Kubernetes which shows key measures of the disease outbreak.

This dashboard is an example of how information from CSV could be analyzed with IRIS Analytics and deployed to GCP Kubernetes in a form of InterSystems IRIS Community Edition.

Added the interactive map of the USA:

19 13
3 986

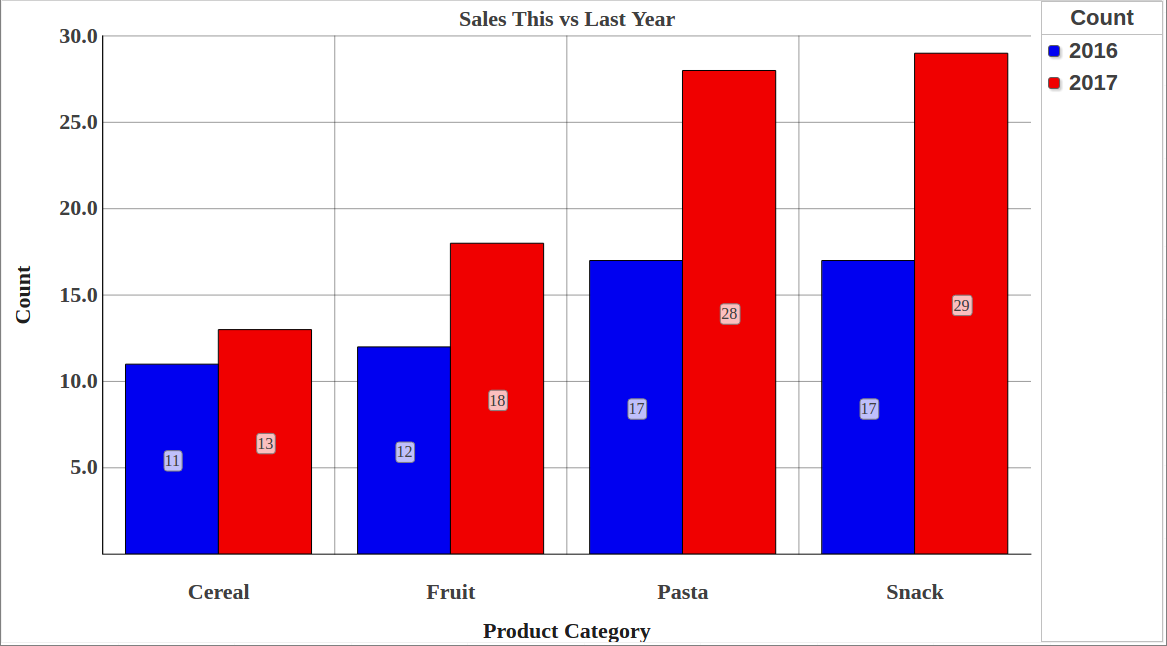
How are we doing THIS year versus the same period LAST year?
This is a common need in Business Intelligence. In fact, many design specifications for reports make use of a comparison between a selected period (year, quarter, etc) up to a certain date (for example November 15th, 2016) and a summary of the same information for the previous year (i.e. up to November 15th, 2015).
This post shows how to implement this in DeepSee.

6 8
0 1.8K

Those of you, who work with DeepSee, might have spotted, that when working with a date hierarchy, there are several functions, allowing you to select a time function for a given level. E.g. for extracting a year from a date/time property when building date hierarchy, you simply use Year function. similarly for month number, quarter and so on. Sometimes, you may wish to see the time - namely hour numbers. For this there is a HourNumber function available with DeepSee. Unfortunately, this function converts time into 12 hours format suffixed with AM/PM to indicate day part.

2 7
0 414

Today my customer ask me a question about how to write the MDX with a summary row however this row with different aggregate functions for each column.

We know in DeepSee analyzer has pivot table option "Summary", user can select sum, avg ... aggregate functions to get the summary row/column. However we can not specify different aggregate function for each measure column.

Here show the example to use All level and IIF function achieve that. see the example (Holefood cube in Sample namespace) below

WITH MEMBER measures.[with avg summary info] AS

2 6
0 1.1K
Article
· Aug 2, 2020 1m read
Application Errors Analytics

Hi Developers!

As you know the application errors live in ^ERRORS global. They appear there if you call:

d e.Log() 

in a Catch section of Try-Catch.

With @Robert Cemper's approach, you can now use SQL to examine it.

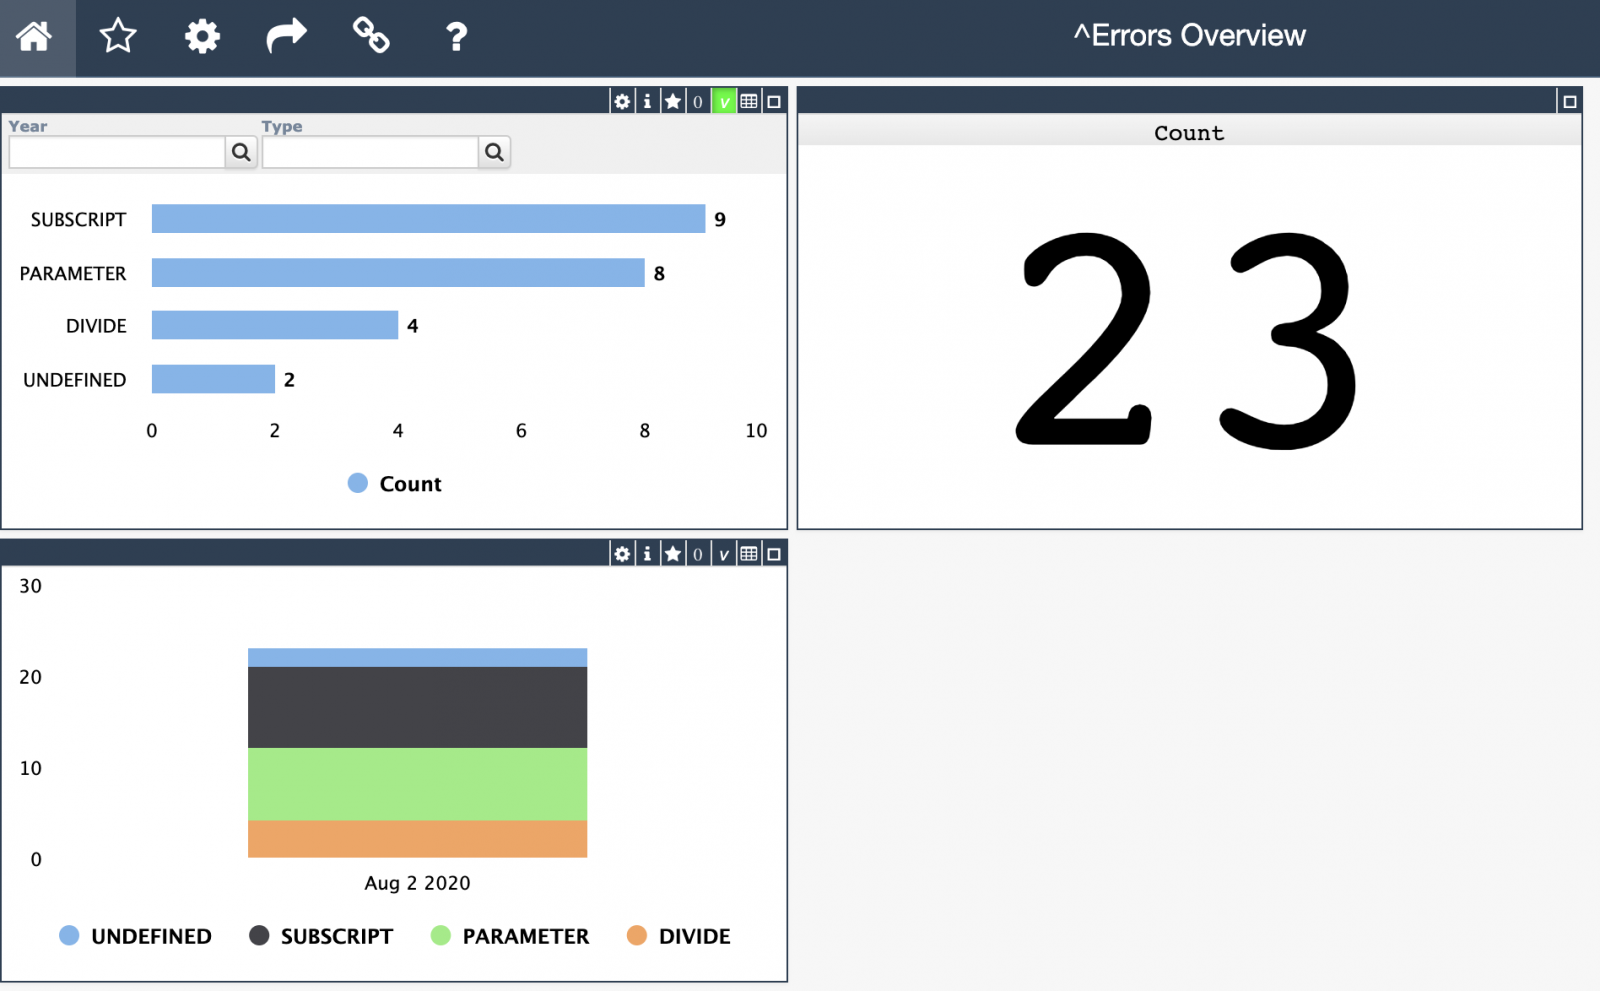
Inspired by Robert's module I introduced a simple IRIS Analytics module which shows these errors in a dashboard:

3 5
1 318

Hi guys.

Recently, I get interest in FHIR in order to run for the IRIS for Health FHIR
contest
. As a beginner on this topic, I've heard somewhat about it, but I didn't know how complex and powerful was FHIR. As pointed out by @Henrique.GonçalvesDias here, you can model several aspects of the patient history and other related entities.

4 5
0 313

The following post outlines an architectural design of intermediate complexity for DeepSee. As in the previous example, this implementation includes separate databases for storing the DeepSee cache, DeepSee implementation and settings. This post introduces two new databases: the first to store the globals needed for synchronization, the second to store fact tables and indices.

5 5
0 730

Pandas is not just a popular software library. It is a cornerstone in the Python data analysis landscape. Renowned for its simplicity and power, it offers a variety of data structures and functions that are instrumental in transforming the complexity of data preparation and analysis into a more manageable form. It is particularly relevant in such specialized environments as ObjectScript for Key Performance Indicators (KPIs) and reporting, especially within the framework of the InterSystems IRIS platform, a leading data management and analysis solution.

4 4
1 177

AnalyzeThis is a tool for getting a personalized preview of your own data inside of InterSystems BI. This allows you to get first hand experience with InterSystems BI and understand the power and value it can bring to your organization. In addition to getting a personalized preview of InterSystems BI through an import of a CSV file with your data, Classes and SQL Queries are now supported as Data Sources in v1.1.0!

6 4
0 576

I have just created a new Global Master Topic, "IRIS Cheatsheets". IRIS has introduced a lot of new functionality, especially in scripting languages, FHIR R4 support, enhanced Interoperability Tools, and IRIS Analytics. Having spent 35 years working on Windows-based PC's and Laptops, I have surprisingly little knowledge of Linux, Docker and Git. Furthermore, I have written almost every application and Interface in ObjectScript with splatterings of SQL, .Net, and Java Gateways and the most basic knowledge of WinSCP, Putty, SSH. All that changed when I received my first Raspberry Pi.

8 3
1 475
Article
· May 28, 2016 3m read
DeepSee Listing Groups

This article is about DeepSee Listing Groups, a new DeepSee feature that was introduced in release 2015.2.

DeepSee Listings have always been a part of DeepSee. DeepSee Listing Groups provide increased flexibility by allowing you to create new DeepSee Listings without modifying the cube definition.

3 3
0 282

Hi Developers!

Often solutions with InterSystems IRIS BI can turn into a quite big solution with dozens of pivots and dashboards.

With every new IRIS BI solution release we can add changes that could influence the behavior of existing pivots or dashboards so they stop working. For example if we change the dimension or measure name, forget deploying some cubes or subject areas, conduct refactoring via mass renaming of cubes and its elements etc some widgets could stop functioning.

6 3
1 264

Hi, Community!

You know, that when we build hierarchies in DeepSee dimension all the members of lower level should be the part of one member of the higher level.

If not you'll get some empty results in MDX queries with this hierarchy.

With Time dimensions the obvious valid hierarchy is Year->Month->Day, cause every Month consists of one Year and every day consists of one month.

2 3
0 406

System Monitor is a flexible and highly configurable tool supplied with Caché (Ensemble, HealthShare), which collects the essential metrics of the operating system and Caché itself. System Monitor also notifies administrators about issues with Caché and the operating system, when one or several parameters reach the admin-defined thresholds.

1 2
2 1.3K

IRIS BI

We offer you to embed business intelligence into your applications in order to give your users an opportunity to ask and answer sophisticated questions about their data. Typically, your application will include customizable dashboards that can provide insight into data from Business Intelligence models known as cubes.

In contrast with traditional BI systems that use static data warehouses, Business Intelligence keeps being constantly synchronized with the live transactional data.

5 2
0 506
Article
· Feb 3, 2023 3m read
Queue monitoring

Overview

With the gradual improvement of hospital information construction, there are more and more business interfaces in hospitals. Due to the influence of various factors (network, consumer system, etc.), the data processing of business interface may cause excessive message accumulation and even the situation of interface card congestion, which affects the normal business development in the hospital. Therefore, the monitoring of the queue of business interface components becomes more and more important.

3 2
0 421

When you have been using cubes for business intelligence in a namespace for some time, you may find that there are many cubes in the namespace, only some of which are actively being used. However, it can be difficult to tell which cubes users are or are not querying, and maintaining unused cubes can be costly both in terms of storage and of computation to keep them up to date. This article provides some suggestions and examples for monitoring which cubes are in active use, and for removing cubes that you determine are no longer necessary.

5 2
2 450