This year while at the Global Summit, I came to learn of a component that Stephen Morrison of Intersystems had written that was capable of infusing SVG content into a PDF document. Apparently Stephen was approached about this and was amenable to sharing the code with us as we have recently encountered a similar need. I'm hoping this post will lead to the sharing of this utility code, so that we can determine if it will indeed suit our need.
InterSystems IRIS Business Intelligence provides the Cube Registry as an interface for managing and scheduling build and synchronize tasks for your cubes.
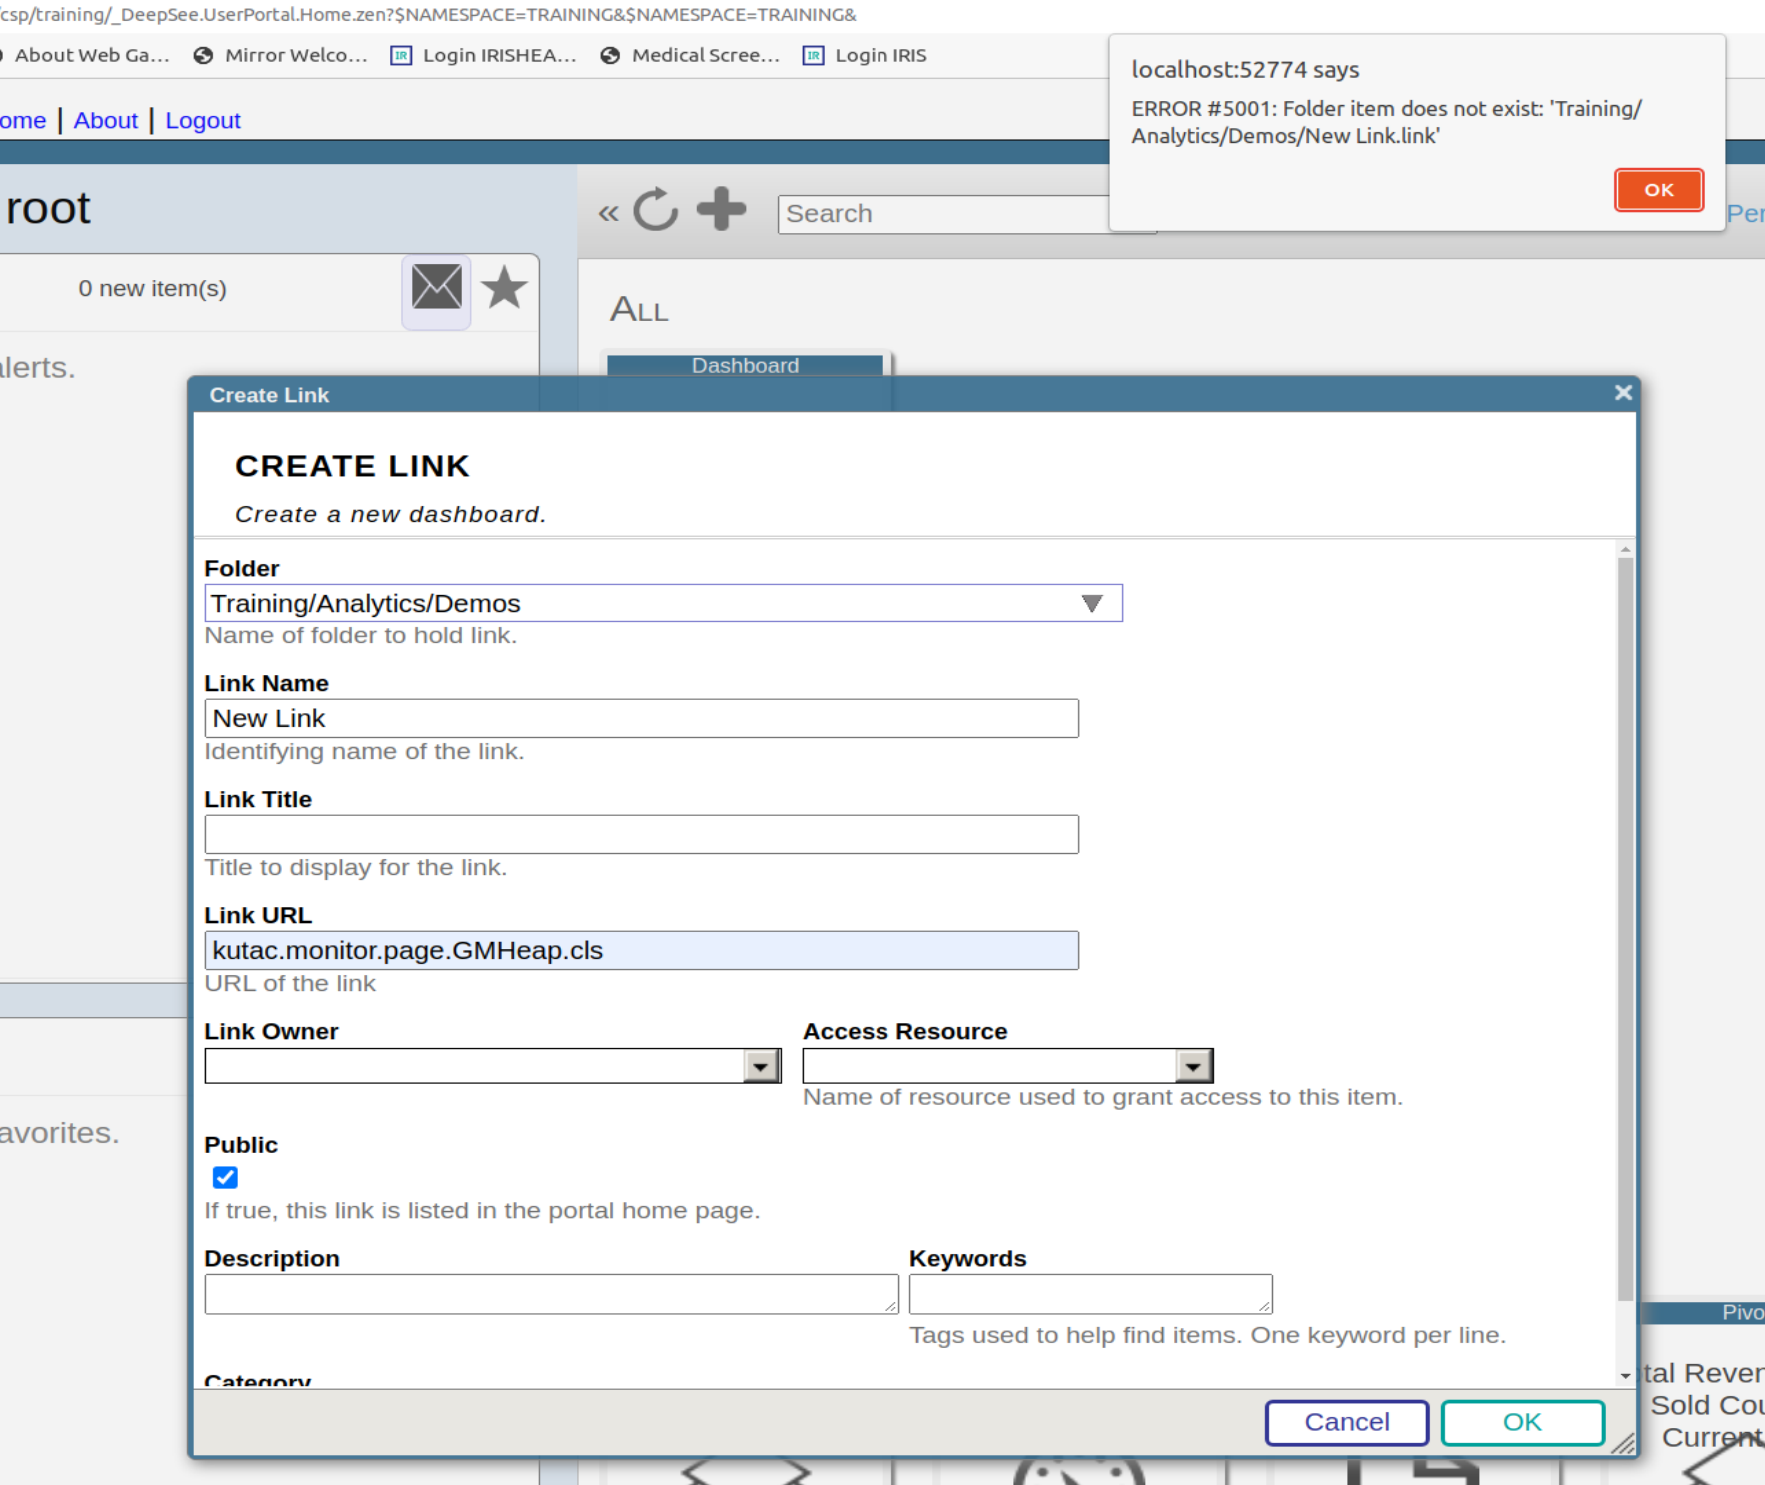
In the previous part of this series, we saw how to define a basic portlet. Now we will look into making this portlet reference a web page that will enhance our dashboard experience.
In this example, we will be embedding a Developer Community article along side a couple of widgets displaying information related to the number of views on the Developer Community articles. This example is not hosted on the Community Analytics server, but if it was we could see the view counts going up as we interacted with the page.
Why use this?
In a real case, perhaps you have an embedded page from an external web site showing the current Emergency Room wait times for Hospitals in your area. This portlet can be used along side widgets from your Emergency Room showing how many people are waiting, how many doctors are active, and how many people are being treated. As other Emergency Room wait times grow, you can possibly expect your volume to increase as well. This can help you make decisions on how to allocate resources.
I work on a dashboard. I understand basic html. I like to draw two boxes in different colors on the background. There will be multiple small boxes inside or over the boxes in the background. I defined the large boxes as <div> and the smaller boxes also as <div> inside the larger <div>. So far so good.
How can I draw lines with arrows between the smaller boxes?
What would be the easiest or best way to filter the options presented by a filter control?
For example, suppose that I create a query using HoleFoods that uses a named filter to filter the product categories according to some criteria. When I display the query on the dashboard, I would like to provide a filter control that will allow users to further constrain the product categories. However, a simple filter control will display all the product categories available in the cube many of which are irrelevant to the current query.
I need an example of what I need to "map" to have a common dashboard defined so it will visible/usable in multiple namespaces.
I have created a dashboard in "SAMPLES" (namespace and database) and I would like to have this dashboard be accessable/useable from a 2nd namespace, but I'm not having any success in doing mappings (global/package/routine/data) to be able to get DeepSee to be able to see/display the dashboard.
I would like to define an advanced filter within my pivot table that allows me to look at diagnosis codes, or at procedure codes - but I do not want to hard code values within the pivot table definition (get the %OR defined).
I would like to be able to allow my dashboard user to chose what specific diagnosis codes or procedure codes they are interested in. So for example one user may want to look for # of patients with cancer dx or patients who have had a radiation procedure.
How can I accomplish this OR feature using dashboard filters?
Hello, I've completed this tutorial: https://community.intersystems.com/post/deepsee-period-date-vs-same-peri... I've used the "year" level instead of a pivot variable. I want to calculate something like the following variation: 100 * ([DateOfSale].[PTD] - [DateOfSale].[LYPTD]) / [DateOfSale].[LYPTD] I create a new calculated member, under the same dimmension with the above expression.
I need to pass multiple values to a FILTER to a DeepSee DASHBOARD via the URL. The documentation seems to indicate this can be done, i.e.: "Where each filterspec is filter_name.filter_values" but there are no examples I can find that indicates what is used to separate multiple values. Say I want to pass the three values 5, 6, and 1395 to a filter. To pass just the 5 I know this works:
&SETTINGS=FILTER:LEAD.MYUSERID.H1.MYUSERID.5
but how do I include 6 and 1395. None of the following seem to work:
When analyzing data, there is often a need to look at specific indicators more thoroughly and to highlight sections of information of particular interest to a user.
For instance, examining the data dynamics for specific regions or dates can help us uncover some hidden trends and patterns that will allow us to make an informed decision about our project in the future.
I like to know how Ican determine the same colors of Series Detail of a graph that applies to all widjets. I created a theme based on a specific widjet and apply to others, but didin´t change the colors of the graph.
In DeepSee we have a field that is numeric but is used as a dimension. In DeepSee it sorts this field in the following order. 10, 11, 15, 2, 3, 5, 6, 8, 990. Is there a way to have DeepSee sort it numerically instead of treating it like a character field? We would want to see it show up in the dimension as 2,3,5,6,7,10,11,15,990.
Is there a way to add a scroll bar to a widget on a dashboard. I want to shorten the width of my bar graph widget but it causes the bar graph to be scrunch together. Also, is there a way to expand the width between each bar on the graph?
I have a DeepSee KPI defined based on %DeepSee.KPI following the documentation http://docs.intersystems.com/latest/csp/docbook/DocBook.UI.Page.cls?KEY=.... I've then enabled the KPI on a dashboard by adding a Widget where the data source is the KPI. Currently the ability to show a Detail Listing is implemented by the call back %OnGetListingSQL. This method documents the parameter
Sometimes I need to filter the widget on a dashboard from a different cube. And I face the following problem:
Widget A refers to a query from Cube A and I want to filter Widget B from Widget B.
Widget's B pivot refers to Cube B, and which has different dimensions for the same data.
E.g. cube A has the dimension Author and the Cube B has the dimension Member for the same data. So there is no way to filter such a widget B from the widget A.
I want to create a dashboard with a line graph that shows system availability over time. I used this code to create a Dashboard:
            Set tItem = ##class(%DeepSee.UserLibrary.Link).%New()
                Set tItem.fullName = "Availability"
                Set tPage = "Availability.UI.CSVImport.zen"
                Set tItem.href = $system.CSP.GetPortalApp($namespace,tPage)_tPage
                Set tItem.title = "Availability"
                Set tSC = tItem.%Save()
In the previous part of this series, we saw how to include data in a portlet from within DeepSee. This used the built in data controller. In this part, we are going to be pulling in data from outside of DeepSee. This will include both information from within InterSystems IRIS and from the OS.
Why use this?
This is useful if you would like to create a dashboard that only contains information about your system. It is also useful if you want to display data about your system along side data that you have stored in DeepSee.
Hi, I cannot edit properties (title etc) of Widgets within Dashboards outside of the ENSDEMO namespace: I have a namespace "HL7Report" for example; I have some Pivots created looking into a cube's data; I click "DeepSee", "User Portal" from the Management Portal; I click "+", "Add Dashboard", folder/name/title/category all as "new", "OK", new dashboard appears; I click ">", "Widgets >", "+", and select a pivot to display as a table (chart / anything);
Aside from doing a print to PDF is there any way to use the existing DeepSee "export to PDF" functionality to export the entire dashboard rather than each individual pivot or chart?
https://www.youtube.com/embed/arqeNXegFDw [This is an embedded link, but you cannot view embedded content directly on the site because you have declined the cookies necessary to access it. To view embedded content, you would need to accept all cookies in your Cookies Settings]
The situation is, I have a Partner that is looking to create common Dashboards in a SaaS model where the Partner's Clients would want to have their individual views of this common dashbaord be branded (logos, color, styles, etc.) to match the Client's branding. This my Partner's Client's End Users will see this common dashboard as the dashboard from the "Client" and not the "Partner" (and certainly not ISC branding)
I regret getting a late start in the InterSystems Analytics contest. I had tried a couple of times before to use Analytics, but I had not gotten too far. I have been recording financial transactions in Excel workbook ever since I had to retire Microsoft Money. Since my iris-for-money was not fully functional, I created a worksheet per account I was tracking. I had developed a CSP page in iris-for-money to import transactions by reading a CSV file.
I would like to pass multiple values of a FILTER from one DeepSee DASHBOARD to another DeepSee DASHBOARD. The documentation indicate this can be done via an URL. Are there any examples this type of configuration?
 All time
 Open Exchange app