Hi Community,

This post is a introduction of my openexchange iris-python-apps application. Build by using Embedded Python and Python Flask Web Framework.
Application also demonstrates some of the Python functionalities like Data Science, Data Plotting, Data Visualization and QR Code generation.

image

Features

  • Responsive bootstrap IRIS Dashboard

  • View dashboard details along with interoperability events log and messages.

  • Use of Python plotting from IRIS

  • Use of Jupyter Notebook

  • Introduction to Data Science, Data Plotting and Data Visualization.

  • QR Code generator from python.

4 1
0 5.7K

Released with no formal announcement in IRIS preview release 2019.4 is the /api/monitor service exposing IRIS metrics in Prometheus format. Big news for anyone wanting to use IRIS metrics as part of their monitoring and alerting solution. The API is a component of the new IRIS System Alerting and Monitoring (SAM) solution that will be released in an upcoming version of IRIS.

11 2
7 2K

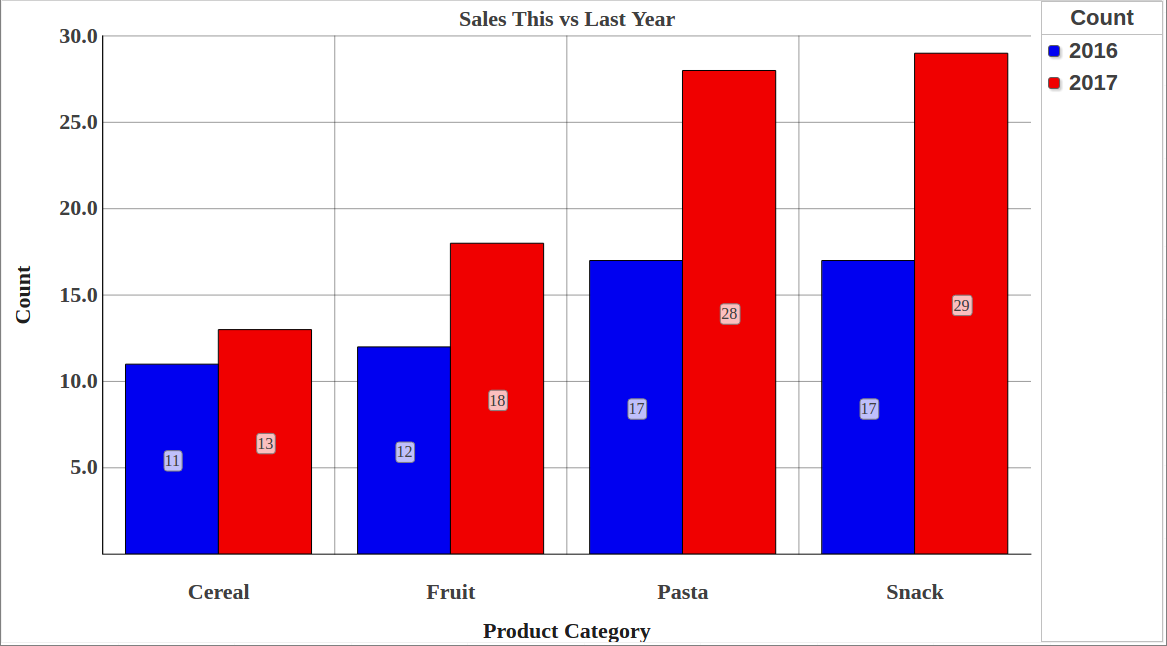
How are we doing THIS year versus the same period LAST year?
This is a common need in Business Intelligence. In fact, many design specifications for reports make use of a comparison between a selected period (year, quarter, etc) up to a certain date (for example November 15th, 2016) and a summary of the same information for the previous year (i.e. up to November 15th, 2015).
This post shows how to implement this in DeepSee.

6 8
0 1.8K

The following steps show you how to display a sample list of metrics available from the /api/monitor service.

In the last post, I gave an overview of the service that exposes IRIS metrics in Prometheus format. The post shows how to set up and run IRIS preview release 2019.4 in a container and then list the metrics.


This post assumes you have Docker installed. If not, go and do that now for your platform :)

18 10
6 1.4K

Now available on Open Exchange is a library of third party charts available to use within DeepSee/InterSystems IRIS BI dashboards. To start, simply download and install, select the new portlet as the widget type, then select the chart type that you desire. If you don't find the type of chart you are looking for, you can easily extend the portlet to implement your desired chart type. These new chart types can be used within existing dashboards or you can create new dashboards using them.

4 0
0 1K
Article
· Mar 2, 2020 2m read
SQL -99 error while viewing a listing

This error is sometimes seen while viewing a listing in InterSystems IRIS Business Intelligence:
ERROR #5540: SQLCODE: -99 Message: User <USERNAME> is not privileged for the operation (4)

As the error suggests, this is due to a permission error. To figure out which permissions are missing/needed, we can take a look at the SQL query that is generated. We will use a query from SAMPLES as an example.

1 0
0 1K

In looking at the Production monitor within Ensemble, I was wondering if there is a way we could customize it for our use. I notice it is basically a dashboard.

For example I would only like to truly display those Services, Processes, and Operations that are truly in dire need of attention. The Monitor out of the box just seems too busy, and I would like to simplify it.

0 2
3 829

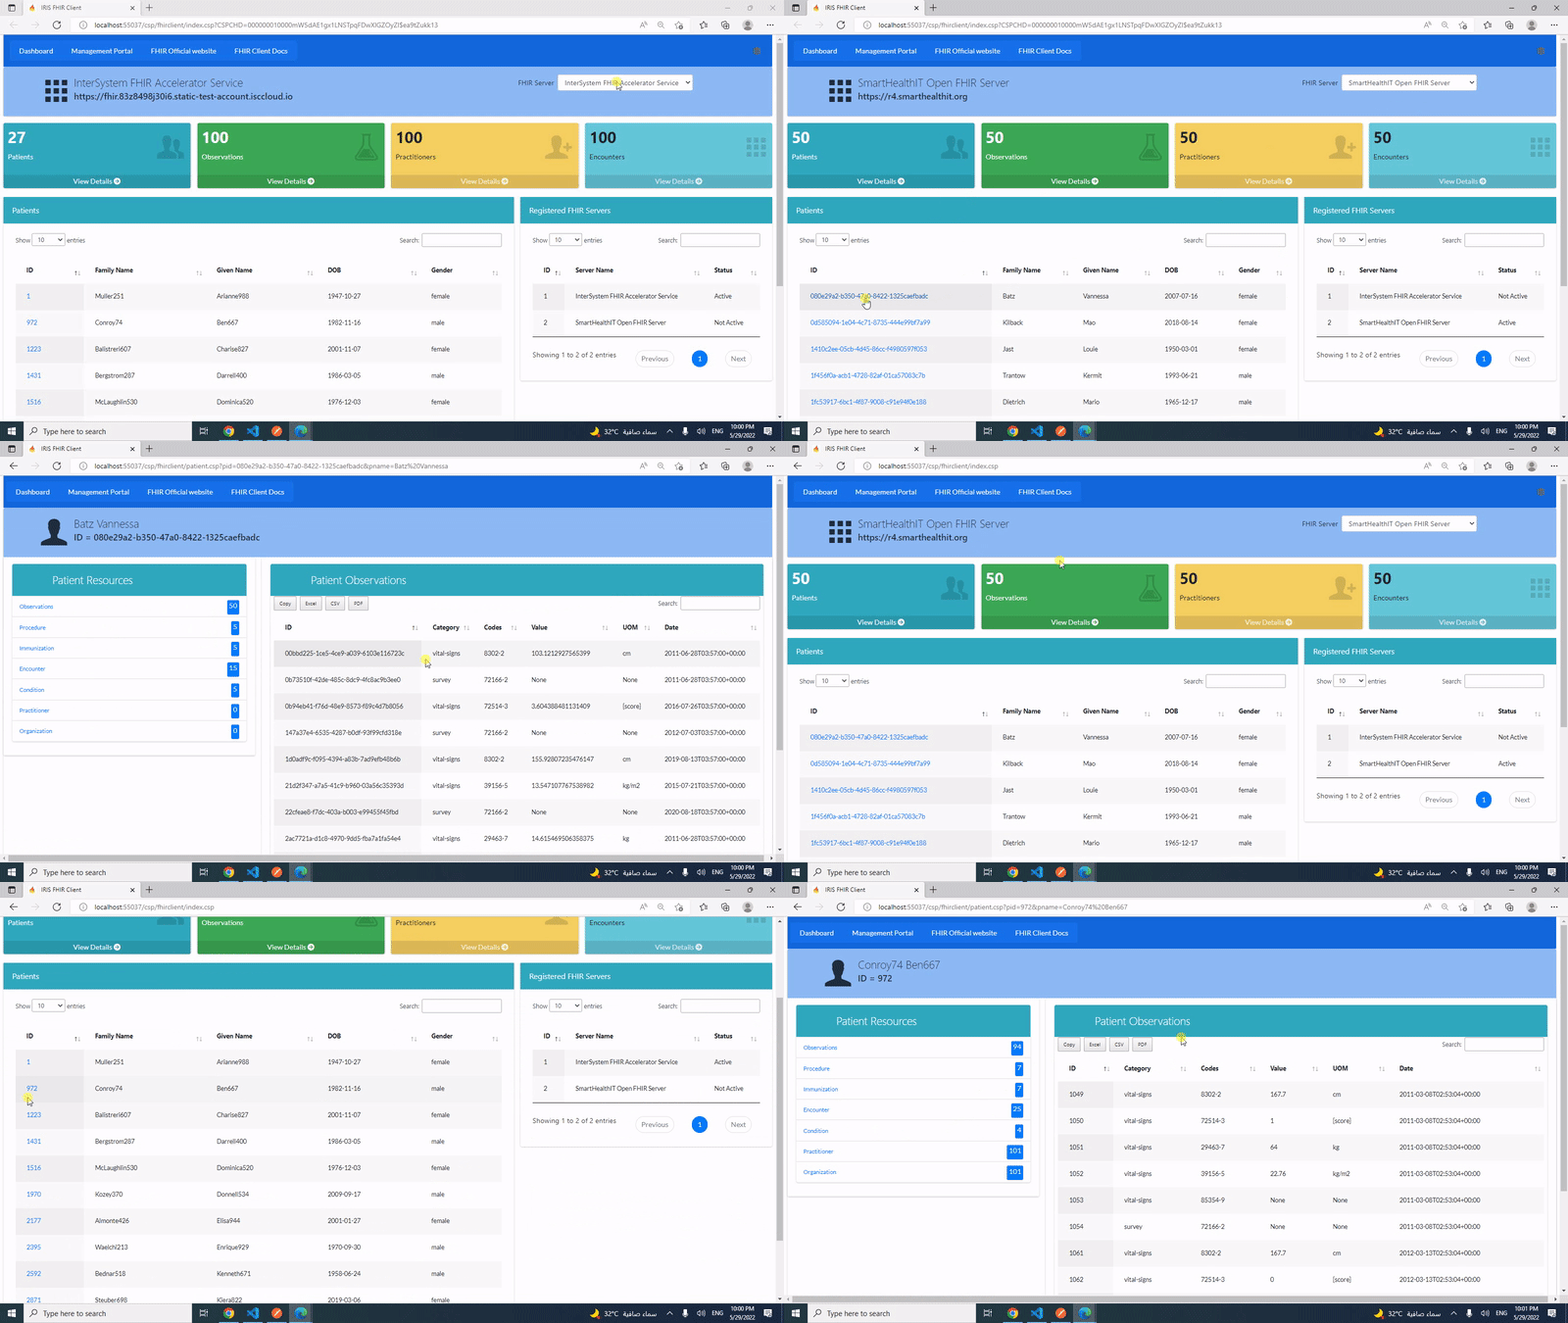
Hi Community,

This post is a introduction of my open exchange iris-fhir-client application.

iris-fhir-client can connect to any open FHIR Server by using embedded python with the help of fhirpy Library.
Get Resource information by terminal and by using CSP web application.

6 2
0 780
Article
· Feb 27, 2022 2m read
Dash-Python-IRIS

We are happy to share interesting information with you, as well as tell you why Python is good, where it is used.

Among the most used libraries are NumPy and Pandas. NumPy (Numerical Python) is used to sort large datasets. It simplifies mathematical operations and their vectorization on arrays. Pandas offers two data structures: Series (a list of elements) and Data Frames (a table with multiple columns). This library converts data into a Data Frame, allowing you to remove and add new columns, as well as perform various operations.

4 1
2 602

What is %SQLRESTRICT

%SQLRESTRICT is a special %FILTER clause for use in MDX queries in InterSystems IRIS Business Intelligence. Since this function begins with %, it means this is a special MDX extension created by InterSystems. It allows users to insert an SQL statement that will be used to restrict the returned records in the MDX Result Set. This SQL statement must return a set of Source Record IDs to limit the results by. Please see the documentation for more information.

Why is this useful?

This is useful because there are often times users want to restrict the results in their MDX Result Set based on information that is not in their cubes. It may be the case that this information may not make sense to be in the cube. Other times this can be useful when there is a large set of values you want to restrict. As mentioned before, this is not a standard MDX function, it was created by InterSystems to handle cases were queries were not performing well or cases that were not easily solved by existing functions.

6 0
1 616

Hi Community,

I am using a method taht calls a Dashboard in Deepsee web from an application , but I want to know if it's possible to not showing the header, this part that have the search button, the name of the namespace, etc..

This is the method :

Method %OnAfterCreatePage() As %Status
{
//Set contratistaId = $Get(%session.Data("ContratistaId"),"")
//Set gerenciaId = $Get(%session.Data("GerenciaId"),"")

1 10
0 555

I've asked a lot of questions leading up to this, so I wanted to share some of my progress.

The blue line represents the number of messages processed. The background color represents the average response time. You can see ticks for each hour (and bigger ticks for each day). Hovering over any point in the graph will show you the numbers for that period in time.

This is super useful for "at a glance" performance monitoring as well as establishing patterns in our utilization.

5 2
0 513

Why log in to view pivot tables when you can have them delivered directly to your inbox? Are you in need of automated reporting for InterSystems IRIS Business Intelligence? Pivot Subscriptions is your solution: a tool for subscribing to scheduled email reports of pivot tables inside InterSystems IRIS Business Intelligence (previously known as DeepSee).

6 0
1 522

Hello, has anyone tried to use Caché as a reverse proxy ?

We are trying to embed a dashboard server (Plotly Dash in this case, but it could be anything which runs on its application server) inside our application which is written in Caché.
The dashboard/report server runs locally (for example, or inside a LAN) on port 8080, and has no authentication features, so we have to implement them on a different layer, and we'd like to use Caché for it.

1 5
0 514
Article
· Dec 12, 2019 2m read
Creating Portlets in DeepSee

What is a portlet?

The simple answer is: a custom widget. A portlet can exist by itself on a DeepSee dashboard, it can be used along side standard DeepSee widgets, or along side other portlets. The rendering of the custom widget is completely user defined. This means you can embed a web page, create a form to perform any sort of action needed based on the data on your dashboard, use third party charting libraries, or simply display data from outside of a DeepSee cube.

How to get started

6 1
0 481

Hi, folks!

When you deploy DeepSee solutions you often do not want grant a User %All Role to work with a particular Dashboard.

Consider a Dashboard 'Dash' with a few widgets where listings are being used.

If you manage a Role to get access to the Dash you need to grant access to %DB_DBNAME resource to have a database access, grant access to a Dashboard resource (if any) and ... grant SELECT accesses to all the tables involved in SQL queries being used in all the listings of widgets.

1 3
0 472
Question
· Nov 23, 2016
DeepSee: Filtering a filter

When creating a filter located on a dashboard that targets all, is there a way to narrow that filter down?

For example, in our data we have some dates that are well out of range due to data quality issues, but they still appear in the drop downs. Is there a way to say, only make available the below dates in the filter?

Another example, If we want to only look at Emergency data, it still provides all the wards for inpatient activity and activity in other hospitals, meaning, to get to just the Emergency wards you have to scroll through everything?

Hope that makes sense.

0 4
0 454

Creating information dashboards, pivot tables, and widgets is an important step in analysis that provides valuable sources of information for informed decision-making. The IRIS BI platform offers many opportunities to create and customize these elements. In this article, we will take a closer look at the basic techniques for developing them and the importance of using them.

7 1
0 427

The pandemic that struck the world in 2020 made everyone follow the news and the numbers that involve the COVID-19.

Why don’t you take that opportunity to create something simple and pleasant, to follow the number of vaccinations worldwide?

To face this challenge, I'm using the data provided by Our World in Data - Research and data to make progress against the world’s largest problems.

They have a dedicated repository on Github with the data of COVID-19, and I took the vaccination data to help me with my tracker.

4 4
0 360

Hello there Intersystems Developer Community,

This year while at the Global Summit, I came to learn of a component that Stephen Morrison of Intersystems had written that was capable of infusing SVG content into a PDF document. Apparently Stephen was approached about this and was amenable to sharing the code with us as we have recently encountered a similar need. I'm hoping this post will lead to the sharing of this utility code, so that we can determine if it will indeed suit our need.

0 2
0 432