By replies
 Open Exchange app
Hello, good morning, thank you so much for reading this question. ☺️🙂👍
We are developing a code to get information about our Production's items: services, processes and operations.
We know we can get various configurations of a given item: Category, Port, Enabled...
But we wonder how we could get the date time of the last mesage (most recent) received in an item.
To give a code snippet a small section of the code we have developed (and tested), it looks like:
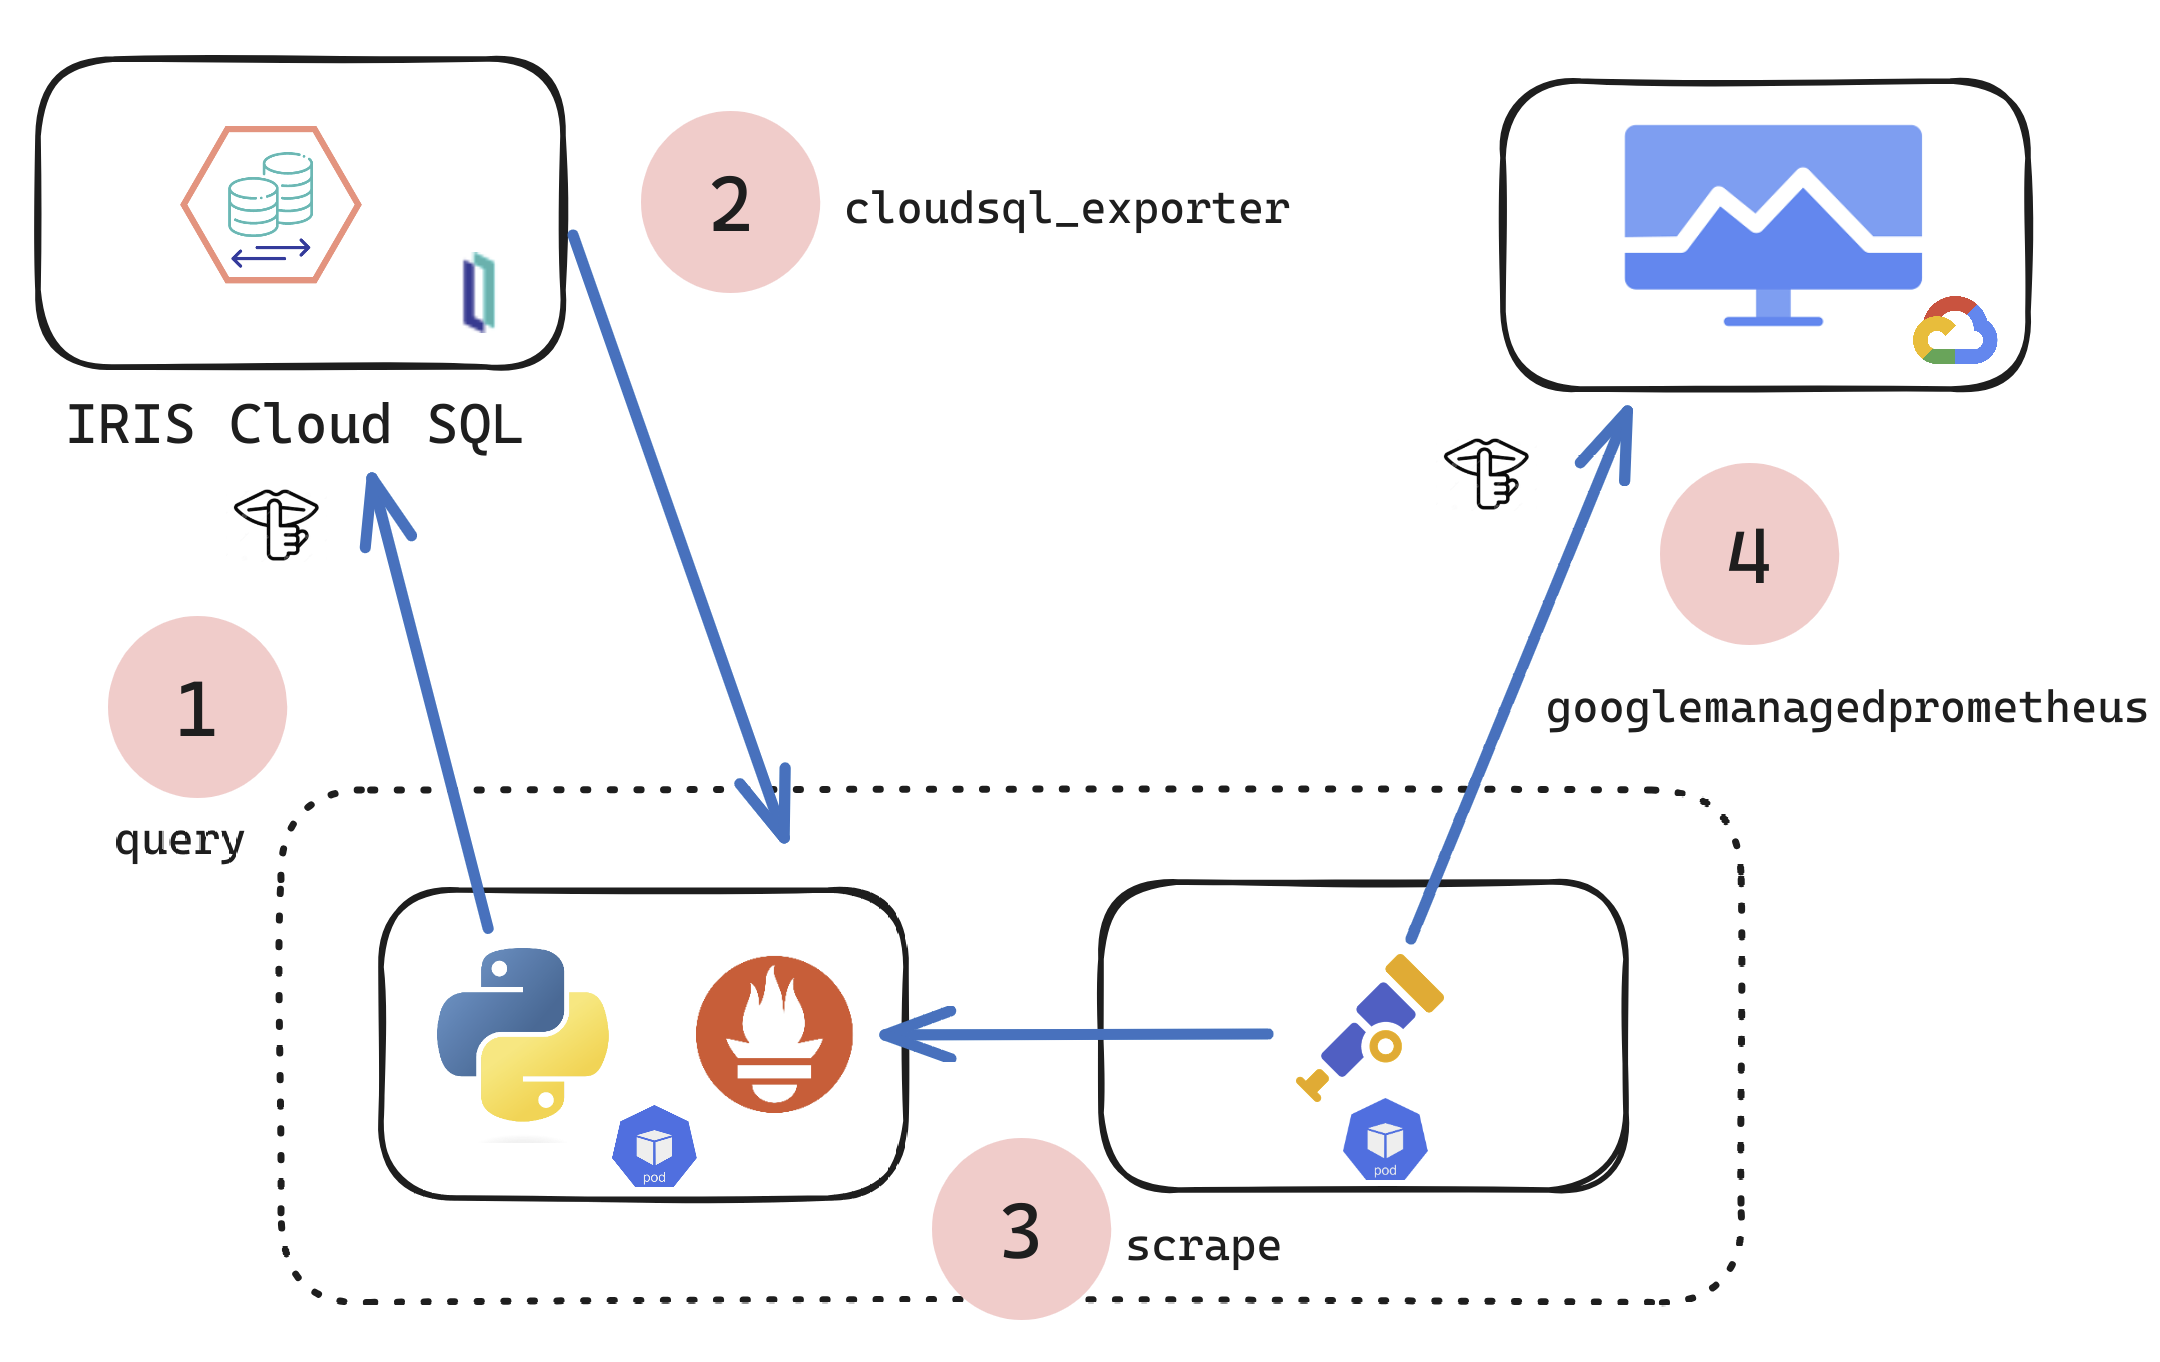
.png)

.png)