Article
· Oct 24, 2016 4m read
DeepSee Troubleshooting Guide

The goal of this “DeepSee Troubleshooting Guide” is to help you track down and fix problems in your DeepSee project.

If the problem can’t be fixed by following the guidelines, you will at least have enough information to submit a WRC issue with DeepSee Support and provide all the evidence to us, so we can continue the investigation together and resolve it faster!

13 16
1 2.4K

There are several options how to deliver user interface(UI) for DeepSee BI solutions. The most common approaches are:

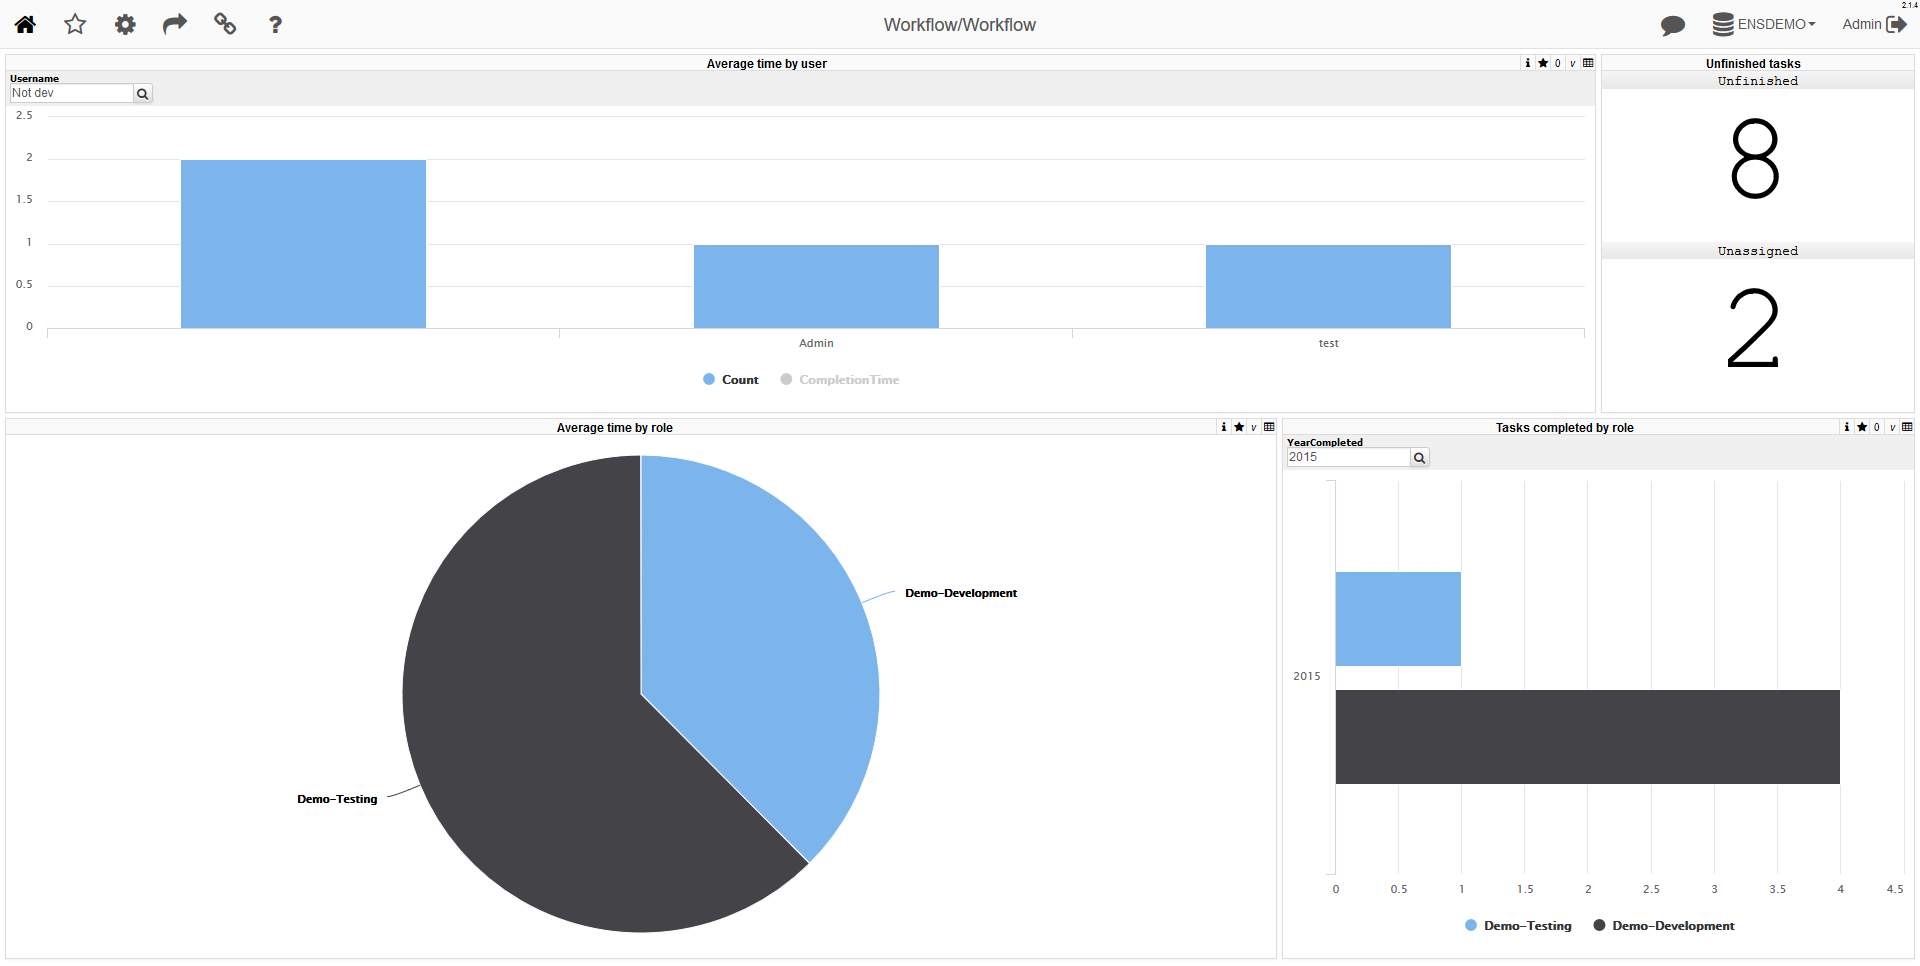
  • use native DeepSee Dashboards, get web UI in Zen and deliver it in your web apps.
  • use DeepSee REST API, get and build your own UI widgets and dashboards.

The 1st approach is good because of the possibility to build BI dashboards without coding relatively fast, but you are limited with preset widgets library which is expandable but with a lot of development efforts.

The 2nd provides you the way to use any comprehensive js framework (D3, Highcharts, etc) to visualize your DeepSee data, but you need to code widgets and dashboards on your own.

Today I want to tell you about yet another approach which combines both listed above and provides Angular based web UI for DeepSee Dashboards - DeepSee Web library.

3 16
5 2.1K

How are we doing THIS year versus the same period LAST year?
This is a common need in Business Intelligence. In fact, many design specifications for reports make use of a comparison between a selected period (year, quarter, etc) up to a certain date (for example November 15th, 2016) and a summary of the same information for the previous year (i.e. up to November 15th, 2015).
This post shows how to implement this in DeepSee.

6 8
0 1.7K

Whether you are accessing DeepSee for the first time ever or you are configuring DeepSee on a new instance, there are two common issues that are encountered after clicking on the “DeepSee” option in the System Management Portal.

Issue #1: Architect/Analyzer is grayed out!

Issue #2: DeepSee must be enabled before use.

Issue #1: Architect/Analyzer is grayed out!

There are two common causes for this problem.

5 1
0 1.5K

System Monitor is a flexible and highly configurable tool supplied with Caché (Ensemble, HealthShare), which collects the essential metrics of the operating system and Caché itself. System Monitor also notifies administrators about issues with Caché and the operating system, when one or several parameters reach the admin-defined thresholds.

1 2
2 1.3K

Today my customer ask me a question about how to write the MDX with a summary row however this row with different aggregate functions for each column.

We know in DeepSee analyzer has pivot table option "Summary", user can select sum, avg ... aggregate functions to get the summary row/column. However we can not specify different aggregate function for each measure column.

Here show the example to use All level and IIF function achieve that. see the example (Holefood cube in Sample namespace) below

WITH MEMBER measures.[with avg summary info] AS

2 6
0 1.1K

Hi colleagues!

Every day Johns Hopkins University publishes new data on coronavirus COVID-19 pandemic status.

I built a simple InterSystems IRIS Analytics dashboard using InterSystems IRIS Community Edition in docker deployed on GCP Kubernetes which shows key measures of the disease outbreak.

This dashboard is an example of how information from CSV could be analyzed with IRIS Analytics and deployed to GCP Kubernetes in a form of InterSystems IRIS Community Edition.

Added the interactive map of the USA:

19 13
3 937

Hi-

I am trying to figure out how to compare two dimension values in a MDX query such that records where two dimension values are the same will be filtered out.

To test this, I have modified the HoleFoods cube in SAMPLES namespace to have a new dimension called RandomRegion

I want to create a MDX query where the [Outlet].[H1].[Region] value is not equal to the [RandomRegion].[H1].[RandomRegion] value.

Here's the query I need to add the filter to:

0 4
0 915

Now available on Open Exchange is a library of third party charts available to use within DeepSee/InterSystems IRIS BI dashboards. To start, simply download and install, select the new portlet as the widget type, then select the chart type that you desire. If you don't find the type of chart you are looking for, you can easily extend the portlet to implement your desired chart type. These new chart types can be used within existing dashboards or you can create new dashboards using them.

4 0
0 868

In DeepSee, having a customer account cube. The cube includes a time dimension AccountCreationDate.

How do you create a calculated measure to get the total number of accounts from the beginning to a certain date in abscissa ?

I tried many things including this:
AGGREGATE(%TIMERANGE([AccountCreationDate].[H1].[MonthYear].&[190001],[AccountCreationDate].[H1].[MonthYear].CURRENTMEMBER) ,[Measures].[%Count])

But I don't get the right result because the date in abscissa creates a filter on the first date.

1 2
0 844

Power BI dashboards provide us with a good way to analyze aggregated information. We can even choose time periods for aggregation (you can find more details regarding it in our article about drill down). However, we might still be interested in a detailed look at specific data points. With the right data filling, we can display detailed data for any column of the chart with all filters applied to that chart.

1 0
0 815

This post provides further detail on the suggestions from the DeepSee Troubleshooting Guide about what to do if a user is not able to view a listing in a DeepSee cube, but instead sees errors like this:

ERROR #5540: SQLCODE: -99 Message: User <username> is not privileged for the operation [zfindStatement+118^%SQL.DynamicStatement.1:<namespace>] (8)

1 1
0 806

Hi, Community!

This is the 3rd part of DeepSee Web story - Angular base UI for DeepSee Dashboards, see the beginning here.

By design, DSW provides an implementation for every widget in DeepSee library. But there are some extra features in DSW which make solutions built with DSW dashboards more functional. This article describes it.

2 0
1 782

In looking at the Production monitor within Ensemble, I was wondering if there is a way we could customize it for our use. I notice it is basically a dashboard.

For example I would only like to truly display those Services, Processes, and Operations that are truly in dire need of attention. The Monitor out of the box just seems too busy, and I would like to simplify it.

0 2
3 776
Article
· Mar 2, 2020 2m read
SQL -99 error while viewing a listing

This error is sometimes seen while viewing a listing in InterSystems IRIS Business Intelligence:
ERROR #5540: SQLCODE: -99 Message: User <USERNAME> is not privileged for the operation (4)

As the error suggests, this is due to a permission error. To figure out which permissions are missing/needed, we can take a look at the SQL query that is generated. We will use a query from SAMPLES as an example.

1 0
0 772

You may experience errors executing Java programs that rely on the JAVA_HOME environment.

For example when Create PDF from this pivot in DeepSee or in this case, outputting a Zen Report as PDF.

You can verify the PDF generation configuration by clicking on the Verify Now button on the Management Portal System > Configuration > Zen Report Settings page:

1 0
0 747

Introduction

Any election is a highly mysterious process, and when you look at its results, the overall picture is not quite clear. I decided to put them, region by region, on the map of Moscow using InterSystems technologies that offer both storage and data analysis functionality. In this particular case, I used InterSystems Ensemble, a platform for application development and integration, but you can also build this solution using the multi-model InterSystems Caché DBMS, as well as InterSystems’ new product called IRIS Data Platform.

3 0
0 703