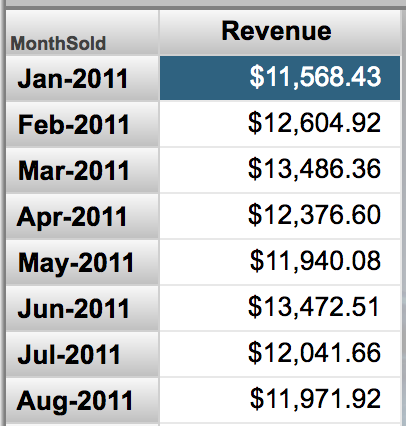
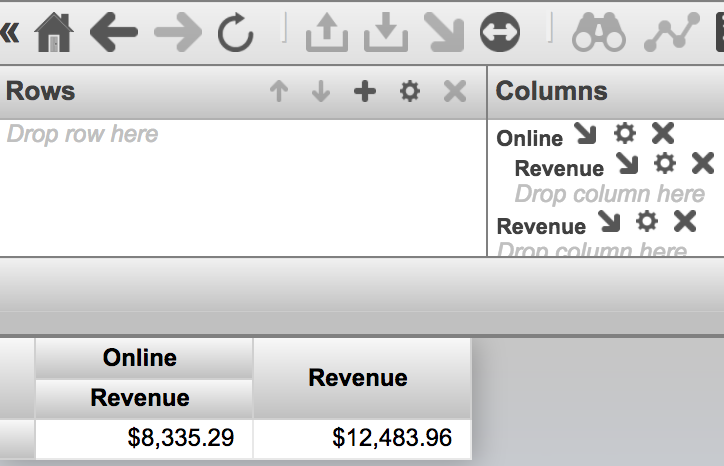
InterSystems IRIS BI (DeepSee) is a Business Intelligence (BI) technology that enables the real-time analysis of transactional data, and is designed to be optimal for embedding within transactional applications.
I need to convert a JSON payload to a custom object type. Currently, I'm converting the JSON object to a %Library.DynamicObject object and need to proceed from here.
As of now, these are my options
1. Using an external library talked about in this link:
The question that I have , it's very simple. I developed a pivot that contains two rows, the first it's a date and the other another field. I need to orde by date in descending order and I can´t find where I can do this. I saw that it's a option Sort members, but it's based in a condition of the measures.
Has anybody tried to extend the Menu on Management Portal? I like to add a new page or a dashboard that will be created soon to the Management Portal and allow others to use it also. I understand there are risks that I could lose things during an upgrade. I am okay with that. Does InterSystems support such an effort?
Hi All,
We have been using DeepSee which has been the integrated Analytic Dashboard built over Cache Cubes. It works fine but it's visual capabilities are limited and most probably is getting phased out.
If I am not wrong, Tableau is the suggested alternative to DeepSee . It is expensive and a big and considerable shift from existing technology
I wanted to get an opinion of the community as to these few key points
- What other BI tools others have been using with IRIS and what have been their experience
- For which tools are the best inbuilt support / api's avaialble in IRIS
I am using a method taht calls a Dashboard in Deepsee web from an application , but I want to know if it's possible to not showing the header, this part that have the search button, the name of the namespace, etc..
I would like to define an advanced filter within my pivot table that allows me to look at diagnosis codes, or at procedure codes - but I do not want to hard code values within the pivot table definition (get the %OR defined).
I would like to be able to allow my dashboard user to chose what specific diagnosis codes or procedure codes they are interested in. So for example one user may want to look for # of patients with cancer dx or patients who have had a radiation procedure.
How can I accomplish this OR feature using dashboard filters?
Is it supported to be able to use member functions to define a set, in particular a set defined with a member range in the form:
set = member1:member2?
The docs only show hardcoded values being used for member1 and member2 and I can get it to work if I use hardcoded values. However if I try to use member functions it throws an error:
"ERROR #5001: Both parts of a range must be members"
How do we return a member from a set? For example if I want a calculated measure to return the NAME of the date with the max transactions, to get the set ordered I might do something like:
But how do I access the first member in the set as a member so that I can get to the properties such as the member NAME (what I want to return in this case)?
In some MDX implementations like Microsoft there are kind of backdoor functions for this like:
Class DSW.Addons.htmlViewer Extends %DeepSee.Component.Portlet.abstractPortlet
{
Property Data As %String;
ClassMethod %OnGetPortletSettings(Output pInfo As %List, ByRef pSettings) As %Status
{
Kill pInfo
Set pInfo(1) = $lb("Data", , , "Data", "Data setting")
Quit $$$OK
}
}
It's a ZEN component and DeepSee portlet. It's immediately available in the namespace I created it in. DSW package is mapped to %ALL and to Samples, but if I try to create a widget with this portlet I get ZEN class not found error.
I want to have a generic PercentOfAll measure that can be used for any dimension of the cube. This PercentOfAll should act like Count, but instead of showing the number of rows in a cell, it will show the percentage (100*number of rows for that member/all rows) .It should not matter what dimension is being viewed. Ex
There are a total of 100 rows in the source class.
I am looking for a reporting tool (Analytics purpose) which can be built using cache object script/MUMPS. Basically my requirement is to find a tool where I can implement cache code to report data for my application.
I am unaware of DeepSee and how it works. Please assist for the same.
My group needs to be able to monitor items / tasks, and let a non-management-portal user see the monitoring. Is it possible to run DeepSee queries on Production items? I feel like I should not be recreating the production environment or the task manager just so that I can query on the items that are running, and on their states (like "successful" or "send email").
Also, I need to log custom events for each task, and I'm running into difficulties with the task manager in this regard; hence the question about using the Production instead, but querying it.
Can someone tell me if intersystems-ru/deepsee-sysmon-dashboards is developed for a specific version of Ensemble? Looks like it could be useful to my group but we aren't upgrading till later this year and we are on 2015.2.2.
I want to include Info icon on DeepSee-Widget title bar like the image below. And when I click or hover on the icon it should display some information about the widget. I tried with the options available in Widget settings and referred InterSystems's documention as well, I couldn't find a way to get this.
Please help me to achieve this. Thanks in advance.
Hi there, We need your help, in the build pivot with DMX, we don't can run the pivot. The MDX use is:
WITH MEMBER [Measures].[CondicionesContCompleta] AS ( IIf([Measures].[CondicionesContCompleta] = Null, 0,[Measures].[CondicionesContCompleta] ) ) SELECT NON EMPTY ( [Gerencia].Gerencia].[Gerencia] ) ON ROWS, NON EMPTY ( [Measures].[CondicionesContCompleta] ) ON COLUMNS FROM [Condiciones]
and when we executed the pivot display the next dialog.
Error#5001: Expected operator within tuple: ('SELECT' @pos 156)(2)
Since I'm just starting to use this aspect of IRIS I can't tell if this is a bug or some kind of nuance. If I run a single column query like this, I get results:
However if I try to retrieve using a DISTINCT or GROUP BY, I get no results:
And again except with a GROUP BY, with no results:
I want to know how I can see all of the export options when the widjet is located in the below part of the window. This example is the deepsee web demo, but it's passing in my real application and I can´t move to another place.
I am programming a daily reporting that will send by e-mail when people will add a dashboard as favorite by clicking on the star :
I asked Intersystems WRC on how to automatically generate a report with some line coding, but I heard there is no way to do this without a headless Browser.
The row expression defines what dimensions and measures appear on the rows of your pivot table as well as how they appear. Sets and CROSSJOINs are used.