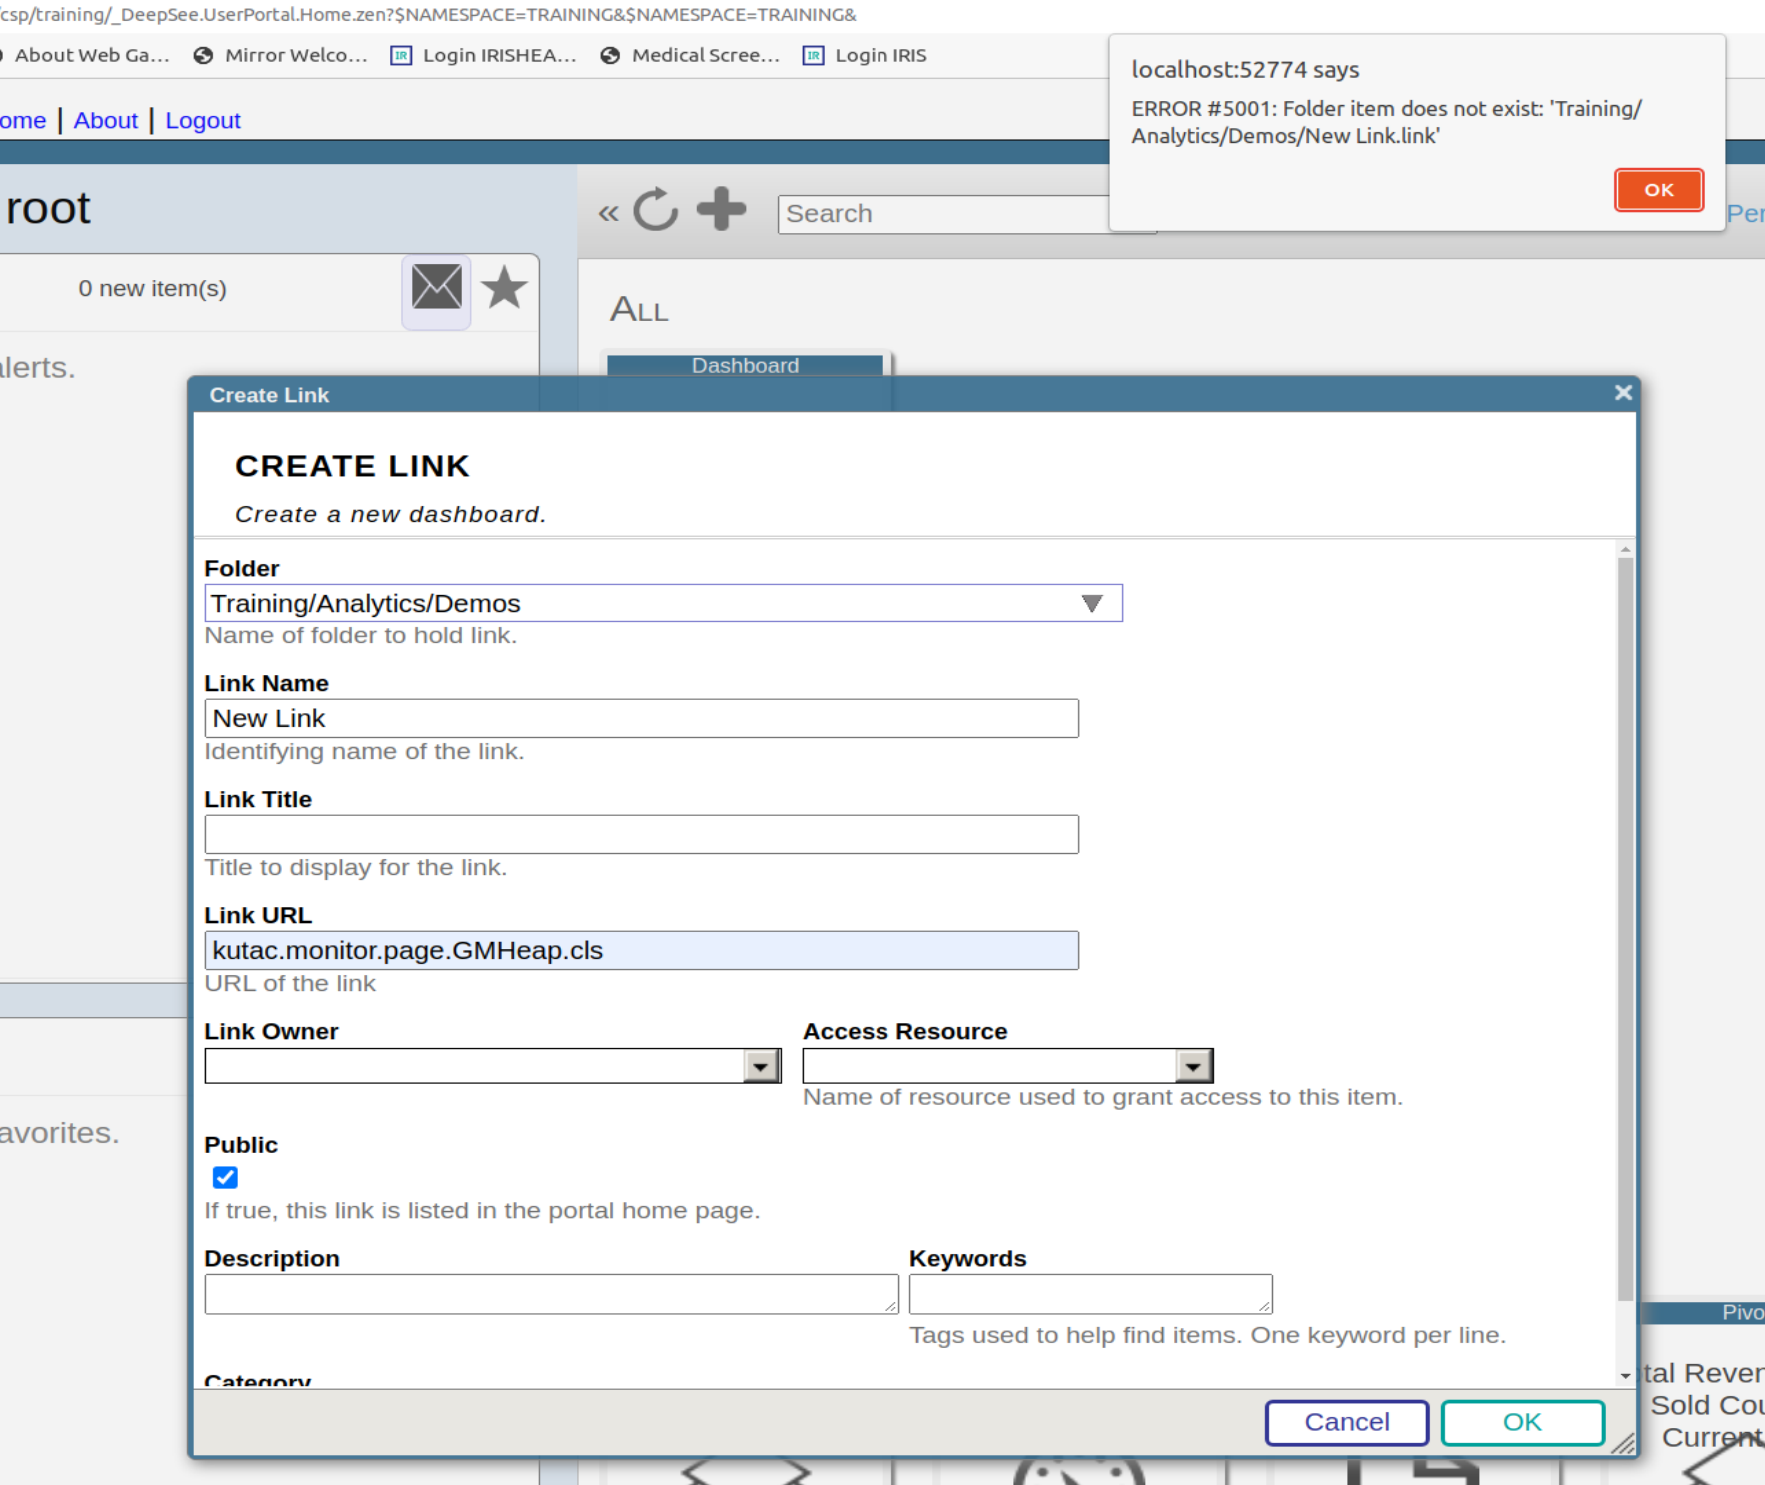
Hello,

Our team is working on building dashboard for internal reference and monitoring.

We would like to have details like Interface Name, Current Status, Last Messages Processed at, IP & Port, Serve/Instance/Production Environment name etc.

If there is any built-in service which we can utilize or any pre-compiled code that we can utilize to build such dashboard.

At this moment want to keep it basic, but moving forward will enhance with more advance features.

Please suggest, any help will be appreciated.

Thanks,

Yash

0 0
0 183
Question
· Apr 26, 2023
Custom Dashboard

I am wondering if anyone has created a custom dashboard that can be accessed outside of the Ensemble environment. What I am looking to do is create a dashboard accessible from a person's computer, on the same company network as Ensemble, that can display information regarding specific services, operations, processes, queues, etc. I don't want to give a user access to Ensemble, just allow them to display a page in their browser to give them the information they need to make sure their processes are running.

0 3
1 190

I built a dashboard to show hourly instrument capacities based on a term list. The term list consists of the TestInstrumentID and the number of tests that instrument can perform in 1 hour. The calculation works correctly and the data is accurate but periodically if you go to check the dashboard the percentages all get changed to 100% across every hour. If you check it later or add an additional site to the filter then the percentages correct themselves. I don't know what's causing this or how to troubleshoot it because it does calculate correctly but is not consistent.

0 6
0 182

I would like to define an advanced filter within my pivot table that allows me to look at diagnosis codes, or at procedure codes - but I do not want to hard code values within the pivot table definition (get the %OR defined).

I would like to be able to allow my dashboard user to chose what specific diagnosis codes or procedure codes they are interested in. So for example one user may want to look for # of patients with cancer dx or patients who have had a radiation procedure.

How can I accomplish this OR feature using dashboard filters?

0 2
0 380

Dear Folks,

I have recently studied deepsee and developed few dashboards needed for our web app users. I am trying to embed them in our existing web app which uses angular with delegated user access. I need to embed the native IRIS dashboard into it. ( I can't use Highcharts or any other js tools).

How do I setup the dashboards to work with delegated authentication (Without providing access to management portal or other parts) ? Also should I use the default csp/{Namespace}/_DeepSee.UserPortal.DashboardViewer.zen? or any other web application URL ?

Thanks

0 1
0 175
Question
· Jul 24, 2020
Uptime reports for Ensemble HL7

Good morning all,

Could we please get some insight on what is possible (or what other organizations may be using) for tracking uptime for our HL7 engine? We can use Activity Tracking to show how many messages went through, but are there any good canned reports (or queries) about the number of message failures or the amount of time that an interface was down?

We are using alerting to the team to know about not getting messages or if messages failed. Has anyone created a report or dashboard against the Ens.Alert table or would you recommend elsewhere?

0 3
0 225

Hello,

I work on a dashboard. I understand basic html. I like to draw two boxes in different colors on the background. There will be multiple small boxes inside or over the boxes in the background. I defined the large boxes as <div> and the smaller boxes also as <div> inside the larger <div>. So far so good.

How can I draw lines with arrows between the smaller boxes?

0 9
0 305

After creating a new dashboard the filters and favorites are not displaying on the left side.

The version info is as follows:

Cache for Windows (x86-64) 2017.2.1 (Build 801_3_18358U) Tue Jul 24 2018 16:38:29 EDT [HealthShare Modules:Core:15.032.8680 + Linkage Engine:15.032.8680 + Clinical Viewer:15.032.8680 + Active Analytics:15.032.8680

Thanks,

LG

0 3
0 147

Hello, has anyone tried to use Caché as a reverse proxy ?

We are trying to embed a dashboard server (Plotly Dash in this case, but it could be anything which runs on its application server) inside our application which is written in Caché.
The dashboard/report server runs locally (for example, or inside a LAN) on port 8080, and has no authentication features, so we have to implement them on a different layer, and we'd like to use Caché for it.

1 5
0 445
Question
· Aug 13, 2019
Dashboard - Line Graph

Hello,

I want to create a dashboard with a line graph that shows system availability over time. I used this code to create a Dashboard:

            Set tItem = ##class(%DeepSee.UserLibrary.Link).%New()
                Set tItem.fullName = "Availability"
                Set tPage = "Availability.UI.CSVImport.zen"
                Set tItem.href = $system.CSP.GetPortalApp($namespace,tPage)_tPage
                Set tItem.title = "Availability"
                Set tSC = tItem.%Save()
0 7
0 285

In looking at the Production monitor within Ensemble, I was wondering if there is a way we could customize it for our use. I notice it is basically a dashboard.

For example I would only like to truly display those Services, Processes, and Operations that are truly in dire need of attention. The Monitor out of the box just seems too busy, and I would like to simplify it.

0 2
3 783

Hi Community,

I am using a method taht calls a Dashboard in Deepsee web from an application , but I want to know if it's possible to not showing the header, this part that have the search button, the name of the namespace, etc..

This is the method :

Method %OnAfterCreatePage() As %Status
{
//Set contratistaId = $Get(%session.Data("ContratistaId"),"")
//Set gerenciaId = $Get(%session.Data("GerenciaId"),"")

1 10
0 503
Question
· Jul 24, 2018
Combo Chart scaling question...

Hi -

I'm trying to get my Combo Chart to dynamically scale the Y axis, but it's not doing what I would like. The 1st Y series, if the MAX value is set to null, scales the chart and the series fine, but then the subsequent Y axis are not to that same scale. Each "null" Max'ed series is setting it's own scale based only on it's own ranges and not in sync with anything else.

Is there a way to force all of the "null" scaled columns to be in the SAME scale as each other AND be dynamic.

0 1
0 226

Hi,
I cannot edit properties (title etc) of Widgets within Dashboards outside of the ENSDEMO namespace:
I have a namespace "HL7Report" for example;
I have some Pivots created looking into a cube's data;
I click "DeepSee", "User Portal" from the Management Portal;
I click "+", "Add Dashboard", folder/name/title/category all as "new", "OK", new dashboard appears;
I click ">", "Widgets >", "+", and select a pivot to display as a table (chart / anything);

0 3
0 313