This tag relates to the discussions on the development of analytics and business intelligence solutions, visualization, KPI and other business metrics management.
In Episode 7 of Data Points, product manager @Carmen Logue joined the pod to tell us all about InterSystems Reports — the new reporting feature of InterSystems IRIS! Take a listen to hear about its capabilities, use cases, and how it fits into the existing set of analytics technologies.
https://5e18edf067eb59-03854285.castos.com/player/172127 [This is an embedded link, but you cannot view embedded content directly on the site because you have declined the cookies necessary to access it. To view embedded content, you would need to accept all cookies in your Cookies Settings]
I'm happy to announce the release of the interface to Julia programming language for InterSystems IRIS. Execute Julia code and more from InterSystems IRIS.
This project brings you the power of Julia right into your InterSystems IRIS environment:
There are several options how to deliver user interface(UI) for DeepSee BI solutions. The most common approaches are:
use native DeepSee Dashboards, get web UI in Zen and deliver it in your web apps.
use DeepSee REST API, get and build your own UI widgets and dashboards.
The 1st approach is good because of the possibility to build BI dashboards without coding relatively fast, but you are limited with preset widgets library which is expandable but with a lot of development efforts.
The 2nd provides you the way to use any comprehensive js framework (D3, Highcharts, etc) to visualize your DeepSee data, but you need to code widgets and dashboards on your own.
Today I want to tell you about yet another approach which combines both listed above and provides Angular based web UI for DeepSee Dashboards - DeepSee Web library.
This error is sometimes seen while viewing a listing in InterSystems IRIS Business Intelligence: ERROR #5540: SQLCODE: -99 Message: User <USERNAME> is not privileged for the operation (4)
As the error suggests, this is due to a permission error. To figure out which permissions are missing/needed, we can take a look at the SQL query that is generated. We will use a query from SAMPLES as an example.
Preview Mode was added to InterSystems IRIS Business Intelligence to give designers a quick view of what their resulting Pivot Table will look like without needing to wait for the results to fully execute. This can be beneficial when designing pivot tables because if you are dragging and dropping elements to see how they look/work in your pivot table and seeing if they have the desired data. Since you are exploring and designing, you don't necessarily care about the results at the moment, but you would still like to see how your table looks with the changes you have made.
https://www.youtube.com/embed/tl7heBWRrVQ [This is an embedded link, but you cannot view embedded content directly on the site because you have declined the cookies necessary to access it. To view embedded content, you would need to accept all cookies in your Cookies Settings]
AnalyzeThis is a tool for getting a personalized preview of your own data inside of InterSystems BI. This allows you to get first hand experience with InterSystems BI and understand the power and value it can bring to your organization. In addition to getting a personalized preview of InterSystems BI through an import of a CSV file with your data, Classes and SQL Queries are now supported as Data Sources in v1.1.0!
Thank you all for your continued feedback and support of our ad hoc reporting platform, VDM. There's been some questions around setting up a non-ODBC connection for InterSystems platforms. We published a new YouTube video showing the steps necessary to connect to InterSystems Caché and InterSystems IRIS with BridgeWorks VDM.
Hi there, We need your help, in the build pivot with DMX, we don't can run the pivot. The MDX use is:
WITH MEMBER [Measures].[CondicionesContCompleta] AS ( IIf([Measures].[CondicionesContCompleta] = Null, 0,[Measures].[CondicionesContCompleta] ) ) SELECT NON EMPTY ( [Gerencia].Gerencia].[Gerencia] ) ON ROWS, NON EMPTY ( [Measures].[CondicionesContCompleta] ) ON COLUMNS FROM [Condiciones]
and when we executed the pivot display the next dialog.
Error#5001: Expected operator within tuple: ('SELECT' @pos 156)(2)
In the previous part of this series, we saw how to include data in a portlet from within DeepSee. This used the built in data controller. In this part, we are going to be pulling in data from outside of DeepSee. This will include both information from within InterSystems IRIS and from the OS.
Why use this?
This is useful if you would like to create a dashboard that only contains information about your system. It is also useful if you want to display data about your system along side data that you have stored in DeepSee.
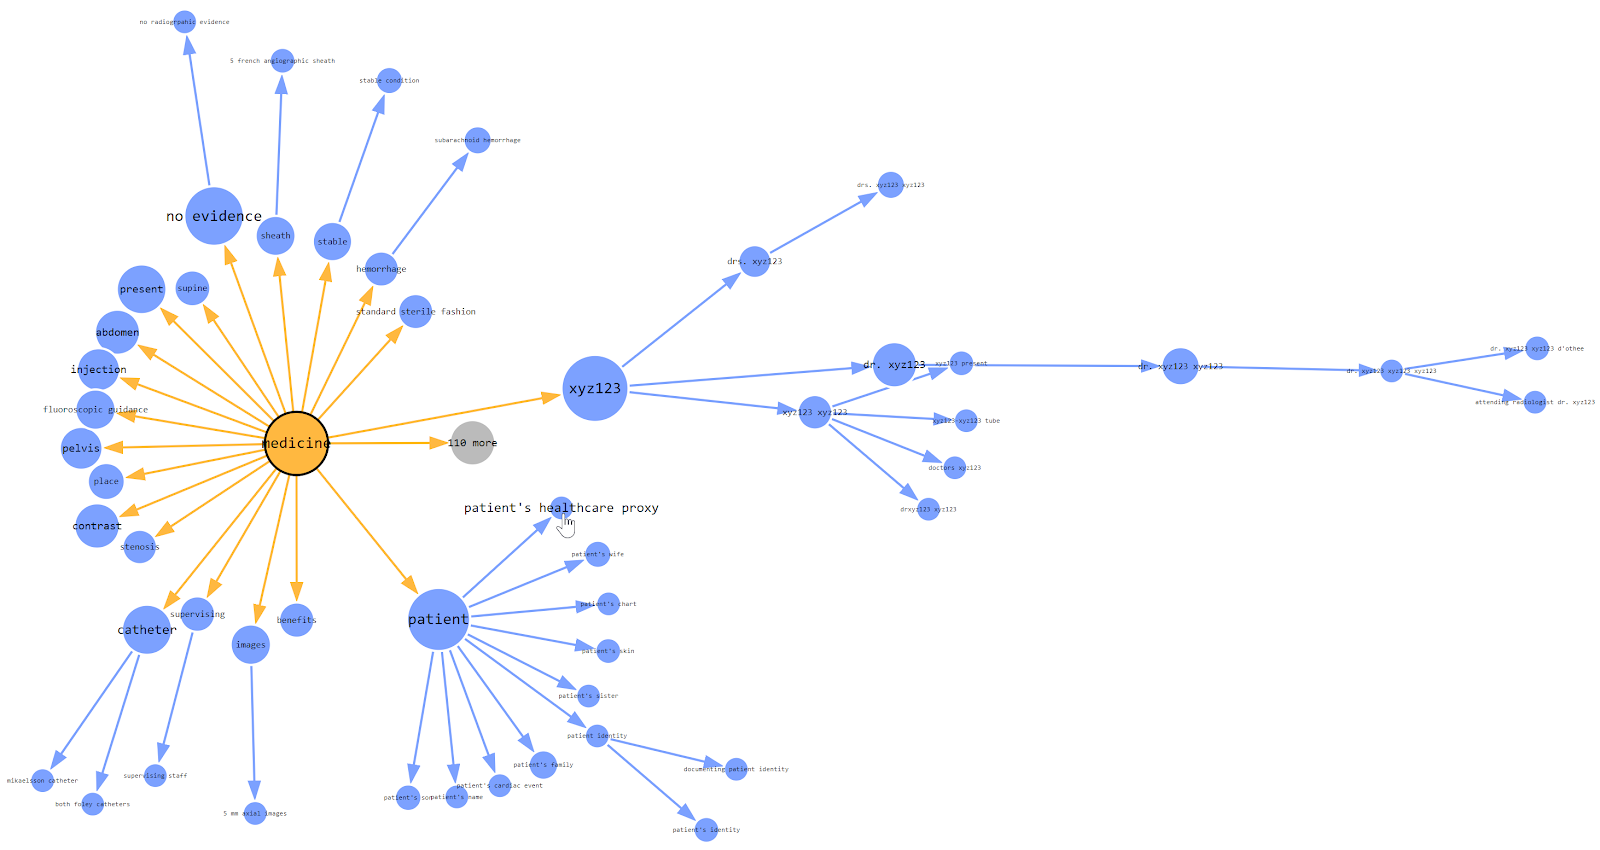
When using Related Cubes in InterSystems IRIS BI, cubes must be built in the proper order. The One side must be built before the Many side. This is because during build time for the Many side, it looks up the record on the One side and creates a link. If the referenced record is not found on the One side, a Missing Relationship build error is generated. The One side is going to be the independent side of the relationship, AKA the side of the relationship that is referenced by the Many side or the Dependent cube. For example: Patients contain a reference to their Doctor.
%SQLRESTRICT is a special %FILTER clause for use in MDX queries in InterSystems IRIS Business Intelligence. Since this function begins with %, it means this is a special MDX extension created by InterSystems. It allows users to insert an SQL statement that will be used to restrict the returned records in the MDX Result Set. This SQL statement must return a set of Source Record IDs to limit the results by. Please see the documentation for more information.
Why is this useful?
This is useful because there are often times users want to restrict the results in their MDX Result Set based on information that is not in their cubes. It may be the case that this information may not make sense to be in the cube. Other times this can be useful when there is a large set of values you want to restrict. As mentioned before, this is not a standard MDX function, it was created by InterSystems to handle cases were queries were not performing well or cases that were not easily solved by existing functions.
In the previous part of this series, we saw how to reference a web page that will enhance our dashboard experience. Now we will look into referencing data that is already in our cubes.
In this example, we will be referencing the controller object and we will be extracting data from it. This data will then be displayed as text in our Dashboard. In Part 5, we will show how to incorporate this data into other charting libraries.
https://www.youtube.com/embed/W2zvl3BO1lA [This is an embedded link, but you cannot view embedded content directly on the site because you have declined the cookies necessary to access it. To view embedded content, you would need to accept all cookies in your Cookies Settings]
In the previous part of this series, we saw how to define a basic portlet. Now we will look into making this portlet reference a web page that will enhance our dashboard experience.
In this example, we will be embedding a Developer Community article along side a couple of widgets displaying information related to the number of views on the Developer Community articles. This example is not hosted on the Community Analytics server, but if it was we could see the view counts going up as we interacted with the page.
Why use this?
In a real case, perhaps you have an embedded page from an external web site showing the current Emergency Room wait times for Hospitals in your area. This portlet can be used along side widgets from your Emergency Room showing how many people are waiting, how many doctors are active, and how many people are being treated. As other Emergency Room wait times grow, you can possibly expect your volume to increase as well. This can help you make decisions on how to allocate resources.
As we announced at our Global Summit in October, we are developing dedicated connectors for a number of third-party data visualization tools for InterSystems IRIS. With these connectors, we want to combine an excellent user experience with optimal performance when using those tools to visualize data managed on InterSystems IRIS Data Platform.
https://www.youtube.com/embed/CCyWcHi1wII [This is an embedded link, but you cannot view embedded content directly on the site because you have declined the cookies necessary to access it. To view embedded content, you would need to accept all cookies in your Cookies Settings]
The simple answer is: a custom widget. A portlet can exist by itself on a DeepSee dashboard, it can be used along side standard DeepSee widgets, or along side other portlets. The rendering of the custom widget is completely user defined. This means you can embed a web page, create a form to perform any sort of action needed based on the data on your dashboard, use third party charting libraries, or simply display data from outside of a DeepSee cube.
https://www.youtube.com/embed/o0T0AgvxaNk [This is an embedded link, but you cannot view embedded content directly on the site because you have declined the cookies necessary to access it. To view embedded content, you would need to accept all cookies in your Cookies Settings]
https://www.youtube.com/embed/wuuCQ6erMFs [This is an embedded link, but you cannot view embedded content directly on the site because you have declined the cookies necessary to access it. To view embedded content, you would need to accept all cookies in your Cookies Settings]
We're excited to announce that we've completed our first Open Exchange submission for InterSystems platforms.
BridgeWorks VDM is an ad hoc reporting and graphical SQL query builder application that was designed for any user who needs access to their SQL projections in InterSystems Caché, InterSystems IRIS, InterSystems IRIS for Health databases as well as access to InterSystems DeepSee and InterSystems IRIS BI Cubes with minimal SQL scripting experience.
Easily transform a CSV file into a personalized preview of DeepSee - InterSystems BI
AnalyzeThis can be found on InterSystems Open Exchange. Use the Download link to navigate to GitHub and begin installing the project. Follow the “Installation” section of the GitHub README.
Why log in to view pivot tables when you can have them delivered directly to your inbox? Are you in need of automated reporting for InterSystems IRIS Business Intelligence? Pivot Subscriptions is your solution: a tool for subscribing to scheduled email reports of pivot tables inside InterSystems IRIS Business Intelligence (previously known as DeepSee).
Fast transfer. Pass globals, classes and tables from InterSystems IRIS to Python with ease and speed (10x faster than old QueryExecute). Documentation.
I recently discovered the Monitoring Activity Volume feature in IRIS and I was amazed by it. So, I put it to work in one of our productions. It is nice how easy it is to set up and all the possibilites that came with it.
But there's something weird: the numbers. Actually, one of the BP is stating a time of more than 6 seconds to process:
 By update
 Open Exchange app
.png)