Hi, Community!
👩⚕️If you need to access clinical data at scale, the InterSystems Bulk FHIR Coordinator can help!
Using the InterSystems Bulk FHIR Coordinator to Extract Clinical Data
This tag relates to the discussions on the development of analytics and business intelligence solutions, visualization, KPI and other business metrics management.
Hi, Community!
👩⚕️If you need to access clinical data at scale, the InterSystems Bulk FHIR Coordinator can help!
Using the InterSystems Bulk FHIR Coordinator to Extract Clinical Data
Starting with InterSystems IRIS 2025.1, the way dependent cubes are handled in cube builds and cube synchronizes was changed.
This change may require modifying custom build/synchronize methods. If you are using the Cube Manager, these changes are already considered and handled, which means no action is needed.
Prior to this change, cubes were required to be built and synchronized in the proper order and account for any cube relationships/dependencies. With this change, dependent cubes are automatically updated as needed when using the %BuildCube or %SynchronizeCube APIs.
New to using Analytics and using Dashboards. We have this Report, SQL Query that lists out the Activity per Data Source in Health Share Provider Directory. Instead of running it as a report, because it takes a while to run, was wondering if there is a way to do this as a Dashboard instead.
.png)
How can I take the SQL from this report and create a Dashboard instead?
I use $SELECT() in Architect to aggregate various data conditions into a single dimension.
I have a data table like this: id, user, userData1, userData2...
Where each user action is the %Integer ID of that action from some source. Then in expression field i use: $SELECT(userAction1:"This user action", userAction2:"That user action".) and so on, up to 14 conditions, excluding the default placeholder 1:"Other" (which is always empty because there is a condition with 100% chance).
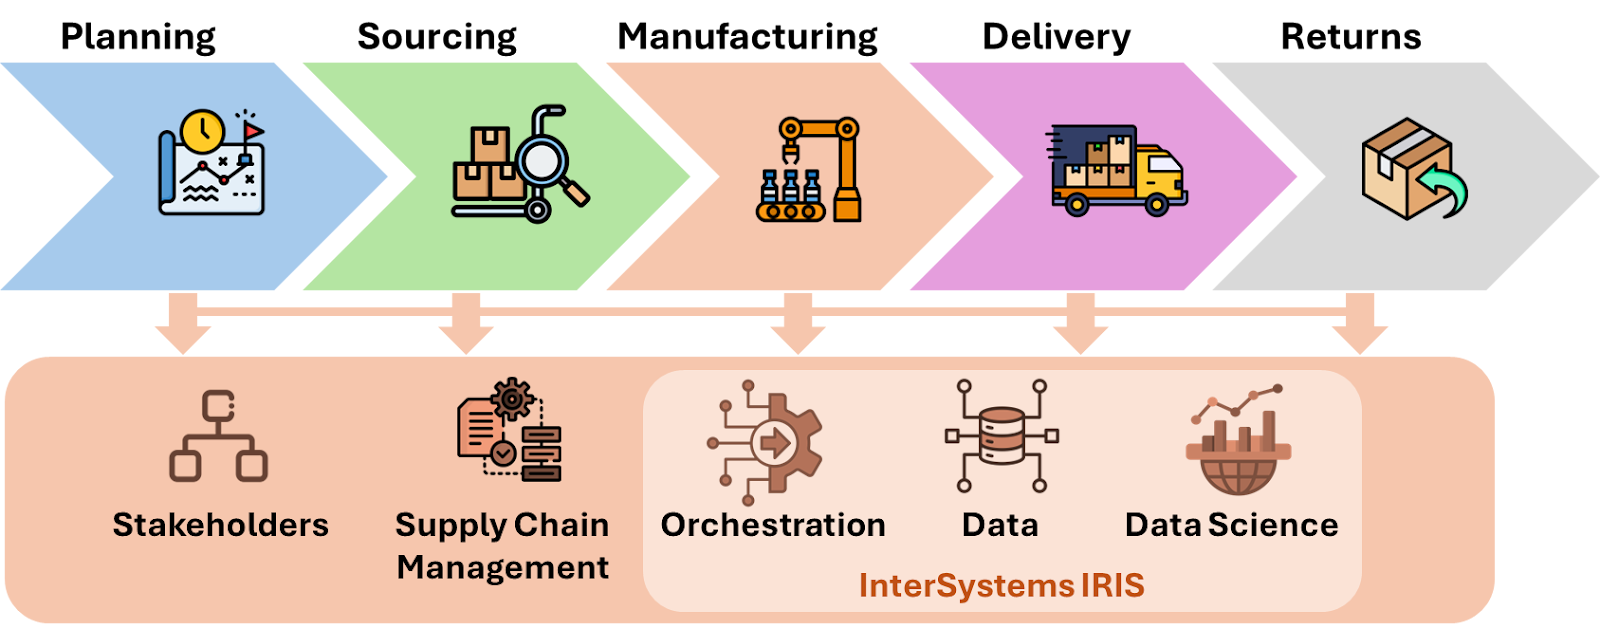
Supply Chain refers to a set of processes and activities performed by the company's business areas and its suppliers and partners (stakeholders), from the acquisition of raw materials, through production, to delivery to the end consumer. It can be better managed using SCM solutions with the orchestration of the InterSystems IRIS:
In Part 1, we explored how window functions operate. We learned the logic behind PARTITION BY, ORDER BY, and such functions as ROW_NUMBER() and RANK(). Now, in Part 2, let's delve into more window functions with practical examples.
These functions compute an aggregate (e.g., sum, average, min, max, count, etc.) over the defined window frame but don’t collapse rows.
Each row remains visible, augmented with aggregated values for its partition.
Supported functions include the following:
Modern data architectures utilize real-time data capture, transformation, movement, and loading solutions to build data lakes, analytical warehouses, and big data repositories. It enables the analysis of data from various sources without impacting the operations that use them. To achieve this, establishing a continuous, scalable, elastic, and robust data flow is essential. The most prevalent method for that is through the CDC (Change Data Capture) technique. CDC monitors for small data set production, automatically captures this data, and delivers it to one or more recipients, including analytical data repositories. The major benefit is the elimination of the D+1 delay in analysis, as data is detected at the source as soon as it is produced, and later is replicated to the destination.
This article will demonstrate the two most common data sources for CDC scenarios, both as a source and a destination. For the data source (origin), we will explore the CDC in SQL databases and CSV files. For the data destination, we will use a columnar database (a typical high-performance analytical database scenario) and a Kafka topic (a standard approach for streaming data to the cloud and/or to multiple real-time data consumers).
This article will provide a sample for the following interoperability scenario:

Hi community
I have a persistent data class where there are some properties that contain underscores in their names, for example:
In Architect, I would like to use this property in an expression, in this field:.png)
But I can't figure it out. If I use %source.client_name, it gives a compilation error. If I use %source."client_name", it treats it as the string "client_name" instead of getting the value from the field. Any suggestions on how to do this?
Can someone give me an explanation of how Local.PD.Linkage.Definition.Individual works? This was setup by another company as part of our implementation.
Below is my configuration..
.png)
We are getting a lot of matches on Given Name, but then the Family Name does not match at all, so I am wondering if these need to be adjusted. I just don't understand if they need to be positive or negative.
if I use the MLE CALIBRATION MONITOR, it seems that none of the values should be negative.
.png)
Hi everyone, on HealthShare Unified Care Record 2024.1.0 Build, we're using the Analytics section to create a dashboard containing a time chart showing a cumulative curve of the number of documents indexed in the registry for each documentSource of each repository. We tried the following steps: we created a cube whose dimensions are the CreationDate, SourceValue, and repositoryUniqueID of the HS_Registry.Document table; in the Analytics section, we created a pivot table that lists the document creation date on each row, along with as many columns as each repository's documentSources.
Hello everyone! 👋
I have a question regarding roles and resources.
To give you some context: I have a user who has been assigned only the role %HS_UsageDashboard_Access.This allows them to access the dashboards correctly (by giving the direct URL). Then, if I try to access the Management Portal with this same user, I can log in with no access to any resources within it (as expected).
The point is that I would like to completely deny him access to the Management Portal, while allowing him to view only the dashboards, as expected from the %HS_UsageDashboard_Access role.
Window functions in InterSystems IRIS let you perform powerful analytics — like running totals, rankings, and moving averages — directly in SQL.
They operate over a "window" of rows related to the current row, without collapsing results like GROUP BY.
This means you can write cleaner, faster, and more maintainable queries — no loops, no joins, no temp tables.
In this article let's understand the mechanics of window functions by addressing some common data analisys tasks.
SQL window functions are a powerful tool for data analysis.
Hey Community,
Enjoy the new video on InterSystems Developers YouTube:
⏯ Analytics and AI with InterSystems IRIS - From Zero to Hero @ Ready 2025
Hello all,
I'm trying to build a cube based on a linked table but seems that IRIS is not able to do it :O
Long story short, I have a linked table in IRIS that sources a Microsoft SQL table (using standard linked feature from the portal). It works fine, I can access it using SQL as many other times. On top of that, I've created in DeepSee (ok, Analytics) a cube that uses this class as source. It compiles correctly, no errors given. When I build it with 100 records, all goes well and using Analyzer I can see results.
Existing cube deleted.
Hi community.
I have a query:
SELECT
nameField,
dateField,
anotherDateField
FROM
(
SELECT
MIN(someDate) as dateField,
nameField,
anotherDateField
FROM $$$SOURCE
WHERE $$$RESTRICT
GROUP by someOtherField
)
WHERE dateField >= anotherDateField
This query should filter the data by the minimum value of the somDate field, but it doesn't. It displays all values together, regardless of the external filter. The exact same query (without the $$$ tokens, of course) works fine in a regular SQL runtime.
My guess is that the $$$RESTRICT does this
WHERE source..png)
.png)
This part of the OMOP Journey, we reflect before attempting to challenge Scylla on how fortunate we are that InterSystems OMOP transform is built on the Bulk FHIR Export as the source payload. This opens up hands off interoperability with the InterSystems OMOP transform across several FHIR® vendors, this time with the Google Cloud Healthcare API.
I’m excited to share the project I’ve submitted to the current InterSystems .Net, Java, Python, and JavaScript Contest — it’s called FHIR Data Explorer with Hybrid Search and AI Summaries, and you can find it on the InterSystems Open Exchange and on my GitHub page.
Hi everyone! 👋
I’m excited to share the project I’ve submitted to the current InterSystems .Net, Java, Python, and JavaScript Contest — it’s called IRIStool and Data Manager, and you can find it on the InterSystems Open Exchange and on my GitHub page.
I work a lot with IRIS BI, but some features are still a mystery to me. There is a great feature here that allows you to create expressions in Architect.
I'm already very familiar with it, but I still don't quite understand what environment it uses.
It can execute system classes like $SYSTEM.SQL, $PIECE(), %cube, %source(), it can do string concatenation, call methods from another classes.
I have two questions actually.
What environment it uses to execute this? Is it ObjectScript, SQL, MDX or maybe even its own?
Ready to elevate your Business Intelligence game?
We've got an engaging video, perfect for all skill levels.
Discover how to get started with IRIS BI, optimize cube performance, and drive analytics adoption. Plus, get a sneak peek at what's next!
.png)
.png)
.png)
Hi everyone,
I am trying to create a treeMapChart in IRIS BI that will then be displayed on my DeepSeeWeb dashboard. In the IRIS BI User Portal, this is an example of what my treeMapChart looks like:
.png)
I know there is a huge amount of rectangles in this graphic - I care most about the common components (the largest boxes) but I still want all of the boxes to show. However, it projects to my DeepSeeWeb dashboard as the following:
.png)
The labels do not show, even if I hover over the boxes.
Sometimes your client may request documentation of your BI or interoperability project in a formal document. In this case, MS Word is a good alternative, as it has an advanced editor that allows you to generate professional documentation. Now it's possible!
The iris4word app has this functionality!
| Final MS Word Document | Word Template |
.png) |
.png) |
.png) |
.png) |
the iris4word get BI asset list and metadata using the InterSystems IRIS BI REST API documented on (https://docs.intersystems.com/healthconnectlatest/csp/docbook/DocBook.UI.Page.cls?KEY=D2CLIENT_rest_api).
Hi Community,
Looking for a more personal approach to learning InterSystems products?
Try one of our live classroom courses! In just a few days, our experienced instructors will help you get up to speed, no matter your role.

Maybe this is well known but wanted to help share.
Consider that you have the following persistent class defintions
An Invoice Class with a property reference to Provider
Class Sample.Invoice Extends (%Persistent, %Populate)
{
Parameter DSTIME = "AUTO";
Property InvoiceNumber As %Integer(MINVAL = 100000) [ Required ];
Property ServiceDate As %Date(MINVAL = "+$h-730") [ Required ];
Index InvoiceNumber On InvoiceNumber;
Property Provider As Sample.I have a widget that uses "choose Data source" control option. Termlist for the control consist of the two data sources and i want to set one of them by default. For example: I have two data sources, one is grouped by month, the other by year. I need to set the one that is grouped by year by default
Using default value at the bottom return an error
How can i achive that?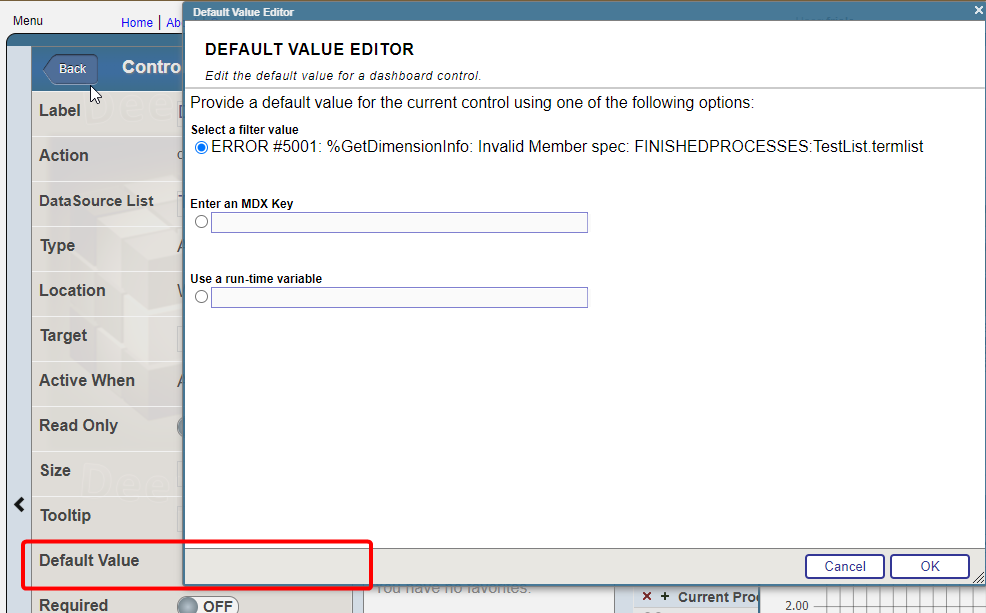
Hey, Community,
Enjoy the new video on InterSystems Developers YouTube:
⏯ A Whirlwind Tour of the Analytics Buffet @ Global Summit 2024