Our team has had success creating and publishing Power BI reports using an ODBC connection to an IRIS database, but there have been concerns about the responsiveness of these reports.

As an attempt to improve responsiveness, I'm trying out the "DirectQuery" connection using the InterSystems IRIS connector available in our version of Power BI Desktop (September 2021).

The version of IRIS I'm connecting with is "IRIS for Windows (x86-64) 2022.2"

0 3
0 1K

Hi All, We have been using DeepSee which has been the integrated Analytic Dashboard built over Cache Cubes. It works fine but it's visual capabilities are limited and most probably is getting phased out. If I am not wrong, Tableau is the suggested alternative to DeepSee . It is expensive and a big and considerable shift from existing technology I wanted to get an opinion of the community as to these few key points - What other BI tools others have been using with IRIS and what have been their experience - For which tools are the best inbuilt support / api's avaialble in IRIS

2 10
0 523

Hello!

I'm trying to make a simple hello world program for iKnow but the documentation only shows examples using the scripting language or XML XData.

The domain is already created and configured, what I hope for is to be able to work with the data in some high-level language.

Is it possible to do something like this:


int domainId = 1;
IKnow iknow = new IKnow( domainId );
List concepts = iknow.getTopConcepts();

Any feedback will be greatly appreciated!

1 8
0 442
Question
· Oct 25, 2018
Healthshare Health Insight

Hello,
I need help in health insight. I am trying to generate reports on deep see but i am not able to pull in the patient ids as these are our requirements for the project. Can anyone help me in unlocking this feature.
Can anyone help me with link to correct documentation on how to access the edge gateways of multiple facilities to access the clinical data on sql explorer.

0 3
0 438

Hi guys,

I'm trying to immigrate some of my HealthInsight dashboards and pivot tables to another HS instance.

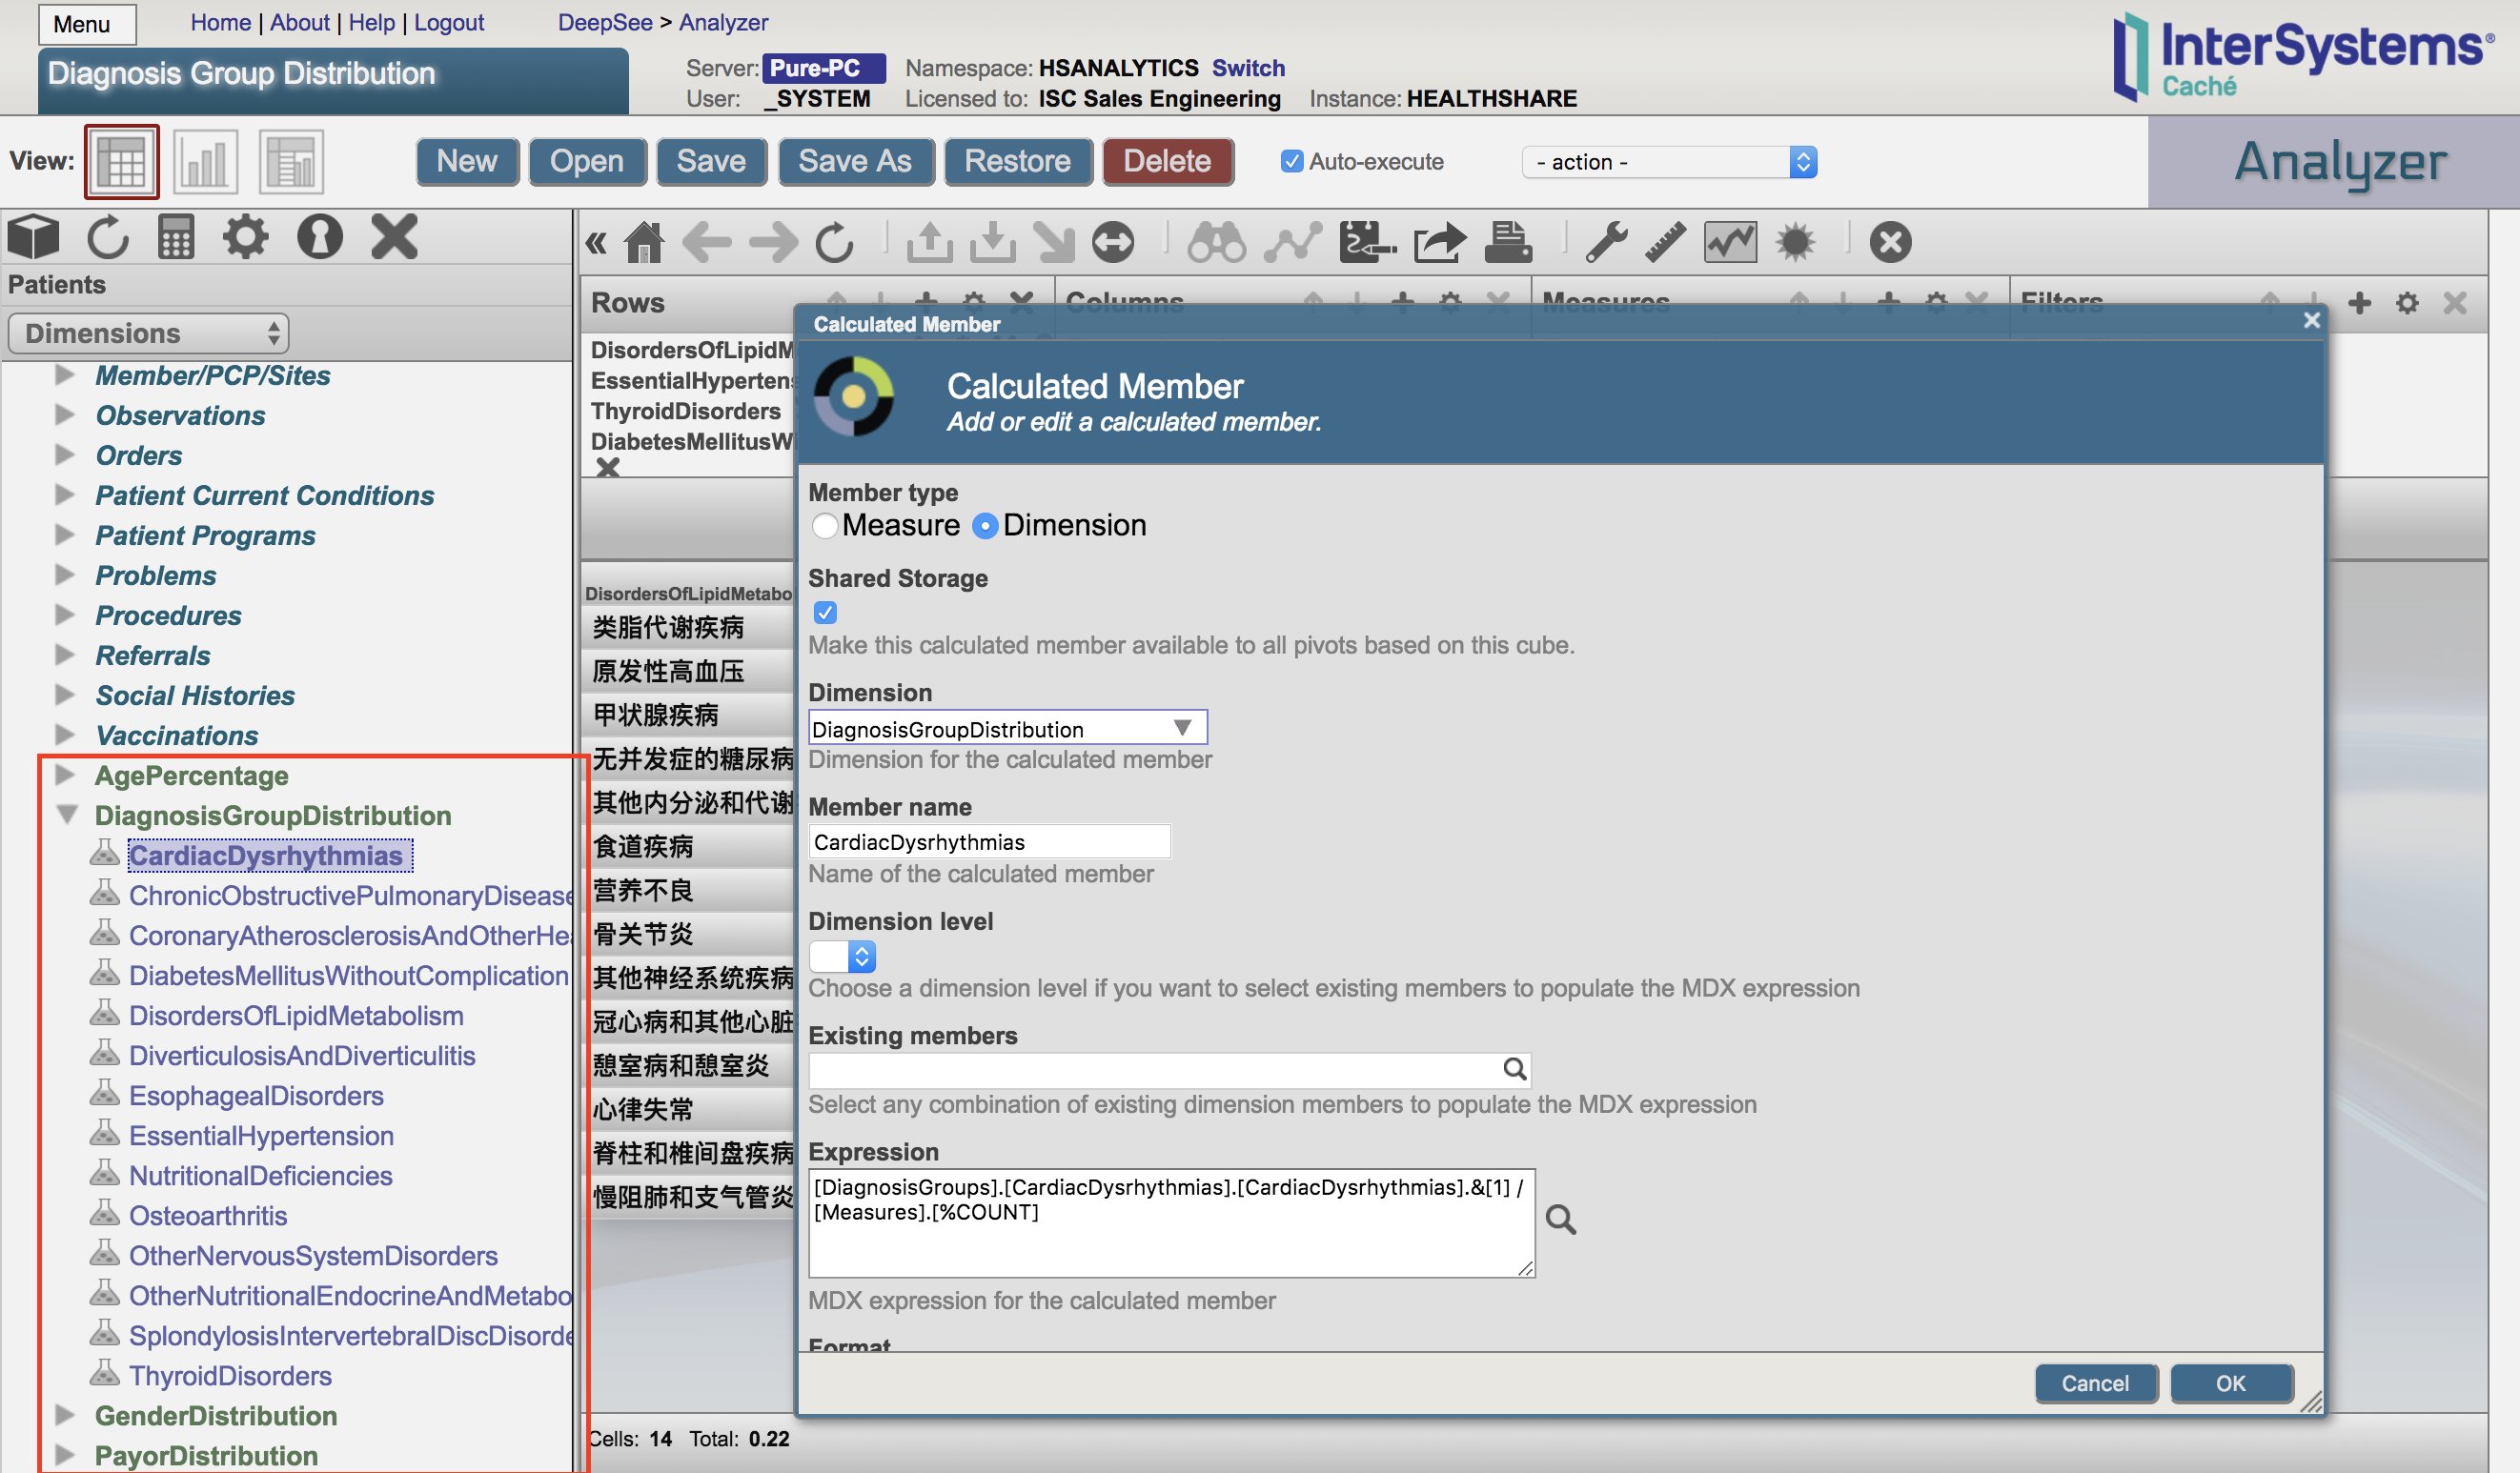
In some pivot tables, I defined them with a set of calculated dimensions defined in the analyzer, e.g as below:

Then when I exported the cubes and pivot tables in used to my new envirmonment. When I open my pivot tables again, the calculated dimensions are missing and hence my pivot tables no longer work:

0 6
0 413

I have a server with rusw locale but in my cube the time dimension shows dates such as "JAN-2018". Is there a way to either localize that (preferably) or just output numbers like "01-2018"?

Architect:

Analyzer:

Also in architect, in level settings there is a "Time Format" property, what's that? Tried setting it to 3 but it didn't help.

0 5
0 393
Question
· Apr 12, 2017
Message Profiling

Hi all,

I was wondering if InterSystems offers any message profiling capabilities. What I mean by "message profiling" is essentially stats or metrics gathered from a collection of data submissions of a particular type. For instance, average number of segments <XYZ> in a specific HL7 V2 message type. Or the number of sections found in a HL7 V3 CDA documents.

Curious if there is anything like this provided "out-of-box".

Thanks!

James

0 4
0 392

I would like to define an advanced filter within my pivot table that allows me to look at diagnosis codes, or at procedure codes - but I do not want to hard code values within the pivot table definition (get the %OR defined).

I would like to be able to allow my dashboard user to chose what specific diagnosis codes or procedure codes they are interested in. So for example one user may want to look for # of patients with cancer dx or patients who have had a radiation procedure.

How can I accomplish this OR feature using dashboard filters?

0 2
0 382

Hello!

My group and I are currently doing a research project on natural language processing and iKnow plays a big role in this project. I am aware that the algorithms iKnow use aren't public, and I respect that.

My question is, are there any public documents/research that explains, at least part of, the algorthims iKnow uses and the motivations for using them?

1 2
0 365

Back in my COBOL days, there was a utility that would analyze running COBOL code and expose bottle necks and those modules that were inefficient or were executed multiple times. This was to help the programmer know where to concentrate streamlining efforts.

Is there any such utility for Caché Routines?

0 4
0 353

Hi all,

I recently discovered the Monitoring Activity Volume feature in IRIS and I was amazed by it. So, I put it to work in one of our productions. It is nice how easy it is to set up and all the possibilites that came with it.

But there's something weird: the numbers. Actually, one of the BP is stating a time of more than 6 seconds to process:

2 6
1 336

I am trying to create a query that returns the best and worst performing products for a given customer, based on this year's net sales versus last year's net sales, weighted by the total net sales for all of the products sold to this customer in the last two years.

I have created Last Year Net Sales (up to the last month end): AGGREGATE(PERIODSTODATE([Invoice Date].[H1].[YEAR],[Invoice Date].[H1].[Month].[NOW-13]),measures.[Net Sales])

0 3
0 331

Hi all,

we are wondering if anybody has a reporting tool that is capable using IRIS Objects?

I know there are things like Crystal Reports and others out there who can read the SQL Data throug ODBC but we need the capability of using object methods while running the report.

Since now we where using a JAVA based report generator (ReportWeaver) but since the object binding for JAVA doesn't exist anymore in IRIS data platform, did any of you have an alternative report generator?

Looking forward to any answers

cheers

Stephan

0 2
0 329

I want to have a generic PercentOfAll measure that can be used for any dimension of the cube. This PercentOfAll should act like Count, but instead of showing the number of rows in a cell, it will show the percentage (100*number of rows for that member/all rows) .It should not matter what dimension is being viewed. Ex

There are a total of 100 rows in the source class.

1 1
0 324

Hi All!

I asked previously about the DR server in the cloud but actually, I'm curious about the backup server to use as analytics server more than for recovery in DR case.

There is a recommended practice to use an async mirror as a server for BI (InterSystems Analytics, DeepSee)

The question is if I have PRIMARY in the cloud (AWS, Google, Azure, etc) "how far" should async mirror member be placed? Same cloud, same private cloud or it doesn't matter at all for analytics purposes?

0 3
0 322

Hi guys,

Does rebuilding of Data Quality Manager cubes affect patient index linkage definition data?

What I want to understand is, does DQM have any negative impact on the data each time you rebuild the cubes.

Additionally, if I make changes to the cube and rebuild it..will this have any impact on the original data?

0 6
0 310