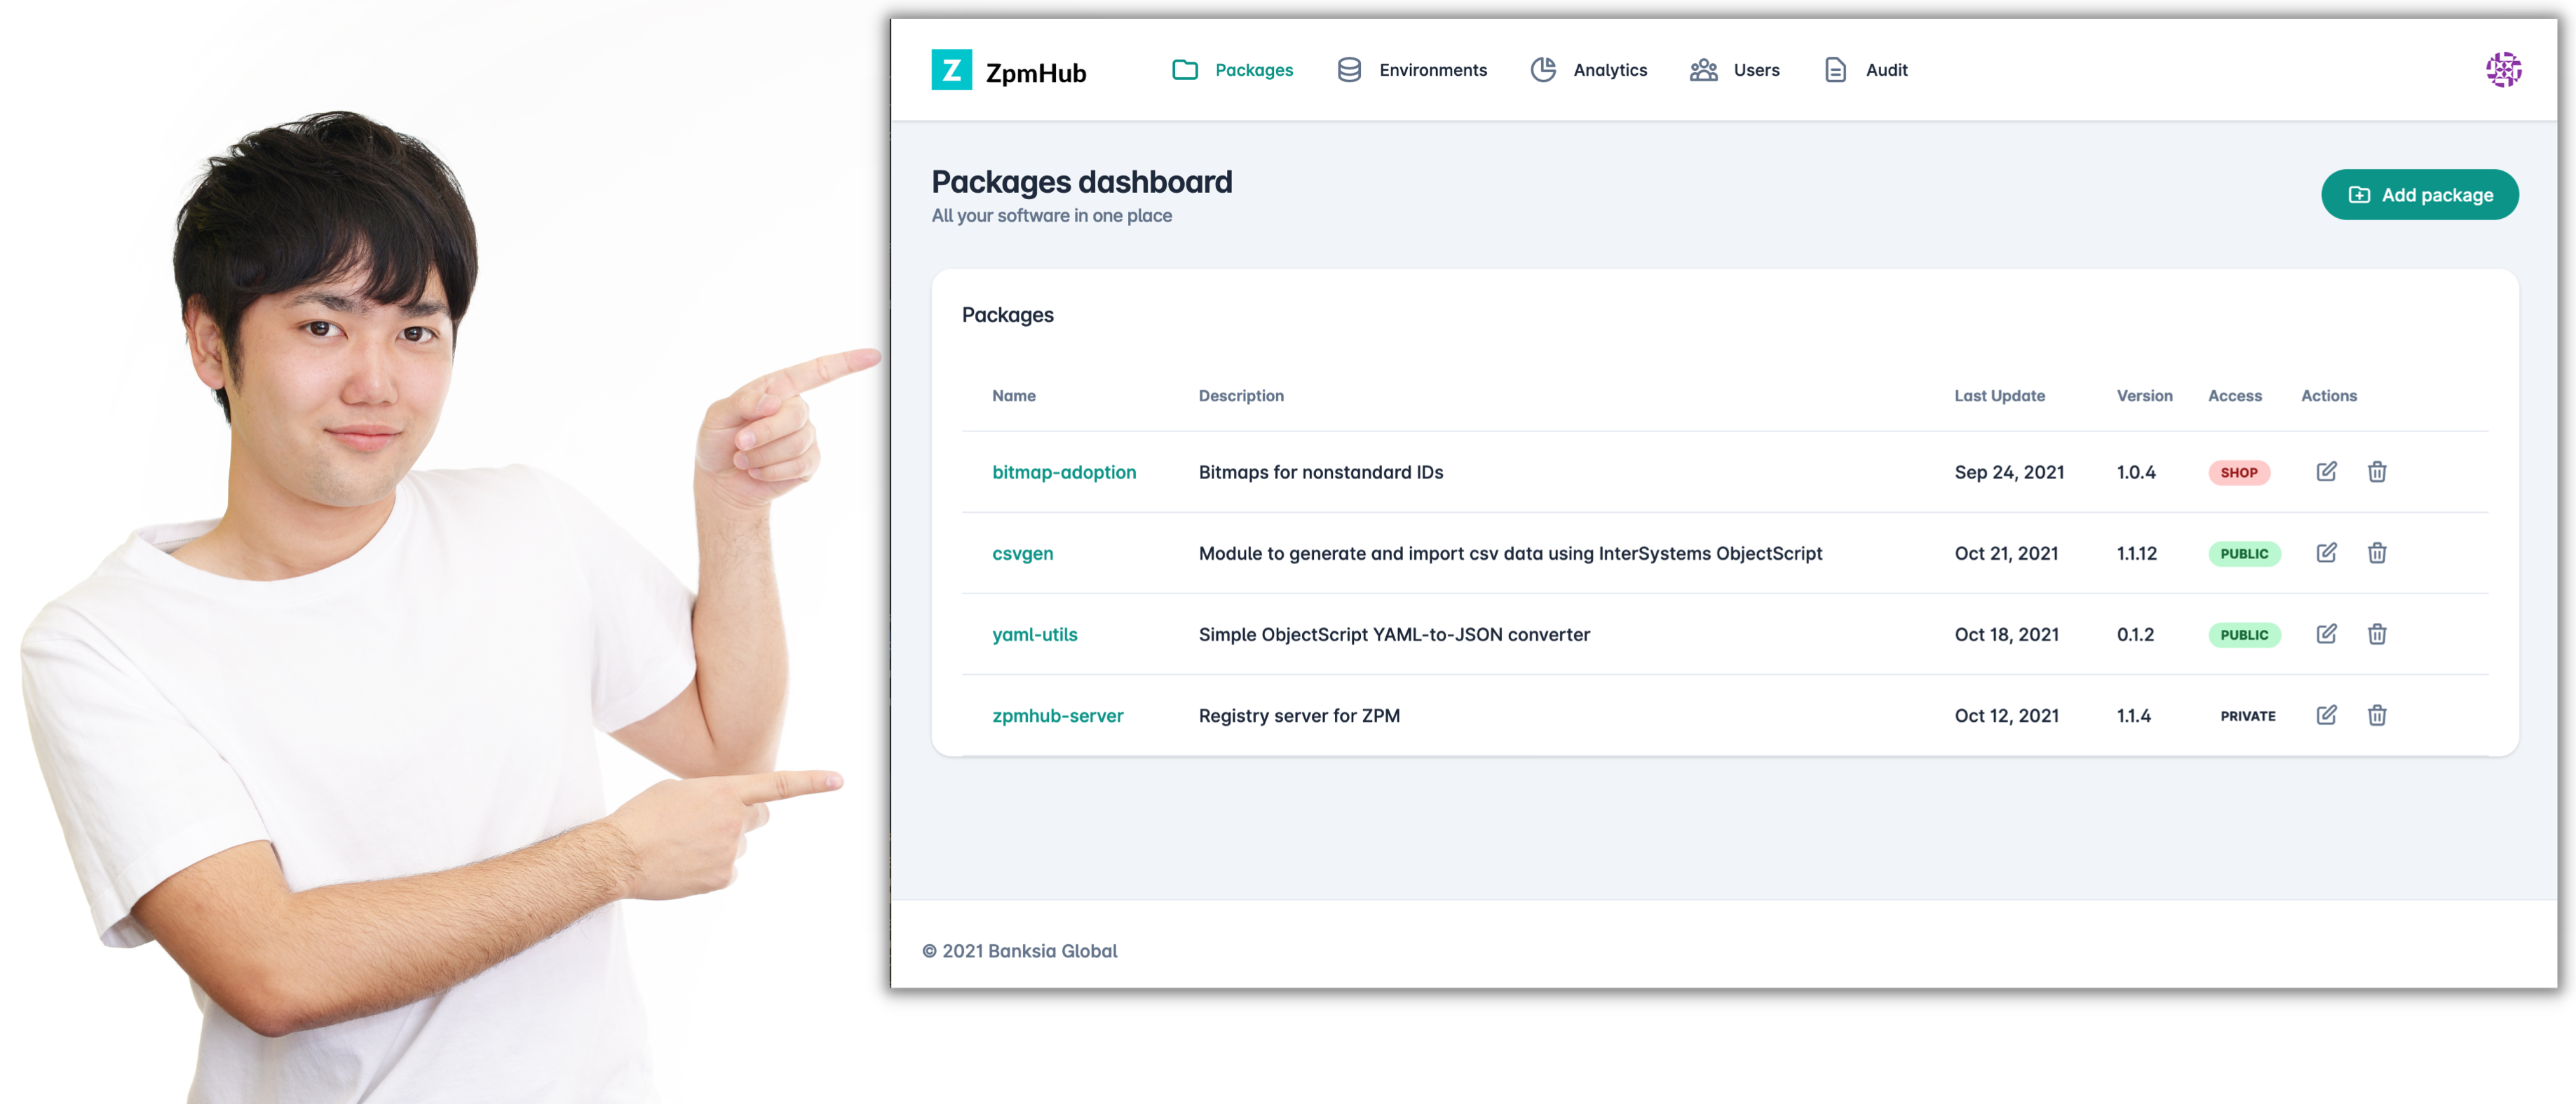
Hey Developers,

Check out the latest video on FHIR API Management:

FHIR API Management: Basic Configuration

https://www.youtube.com/embed/EYZ4dXNZNSY
[This is an embedded link, but you cannot view embedded content directly on the site because you have declined the cookies necessary to access it. To view embedded content, you would need to accept all cookies in your Cookies Settings]

FHIR API Management: FHIR Dev Portal

https://www.youtube.com/embed/9yEm7ZAZENI
[This is an embedded link, but you cannot view embedded content directly on the site because you have declined the cookies necessary to access it. To view embedded content, you would need to accept all cookies in your Cookies Settings]

FHIR API Management: Logging and Monitoring

https://www.youtube.com/embed/xcHjcBTLw8o
[This is an embedded link, but you cannot view embedded content directly on the site because you have declined the cookies necessary to access it. To view embedded content, you would need to accept all cookies in your Cookies Settings]

FHIR API Management: Security

https://www.youtube.com/embed/7ImJPCdp96A
[This is an embedded link, but you cannot view embedded content directly on the site because you have declined the cookies necessary to access it. To view embedded content, you would need to accept all cookies in your Cookies Settings]

3 0
0 364

Hi All,

With this article, I would like to show you how easily and dynamically System Alerting and Monitoring (or SAM for short) can be configured. The use case could be that of a fast and agile CI/CD provisioning pipeline where you want to run your unit-tests but also stress-tests and you would want to quickly be able to see if those tests are successful or how they are stressing the systems and your application (the InterSystems IRIS backend SAM API is extendable for your APM implementation).

4 0
1 639

GA releases are now available for the first version (v1.0) of InterSystems System Alerting and Monitoring (InterSystems SAM for short)

InterSystems SAM v1.0 provides a modern monitoring solution for InterSystems IRIS based products. It allows high-level views of clusters and single-node drilled down metrics-visualization together with alerts notifications. This first version provides visualization for more than one hundred InterSystems IRIS kernel metrics, and users can extend the default-supplied Grafana template to their liking.

5 2
0 434

Hi,

During the implementation of iris-history-monitor using ZPM, I'm bumping on the following scenario:

My Installer.cls has a call for the Custom Sensors Class method. The Custom information looks like a charm as I described in this article:

IRIS History Monitor using custom built-in REST API /api/monitor/metrics

But, now I'm trying to replicate the same behavior using the module.xml to work with ZPM.

0 4
0 214

Preview releases are now available for the first version (v1.0) of InterSystems System Alerting and Monitoring (InterSystems SAM for short).

InterSystems SAM v1.0 provides a modern monitoring solution for InterSystems IRIS-based products. It allows high-level views of clusters and single-node drilled down metrics-visualization together with alerts notifications. This first version provides visualization for more than one hundred InterSystems IRIS kernel metrics, and users can extend the default-supplied Grafana template to their liking.

V1.0 is meant to be a simple and intuitive baseline. Please help us make it great by trying it and sending us feedback!

SAM can display information from InterSystems-based instance starting with version 2019.4

SAM is only available in container format. You will need the SAM Manager container plus a small set of additional open-source components (Prometheus and Grafana) that are added automatically by the composition file.

SAM components and the SAM Manager Community Edition are available from

If you are traveling or prefer a voice-based Q&A description on what SAM is, here is a podcast we have prepared for you:

https://5e18edf067eb59-03854285.castos.com/player/198587
[This is an embedded link, but you cannot view embedded content directly on the site because you have declined the cookies necessary to access it. To view embedded content, you would need to accept all cookies in your Cookies Settings]

7 2
2 771

Hey Developers,

We're pleased to invite you to join the next InterSystems IRIS 2020.1 Tech Talk: DevOps on June 2nd at 10:00 AM EDT!

In this InterSystems IRIS 2020.1 Tech Talk, we focus on DevOps. We'll talk about InterSystems System Alerting and Monitoring, which offers unified cluster monitoring in a single pane for all your InterSystems IRIS instances. It is built on Prometheus and Grafana, two of the most respected open source offerings available.

Next, we'll dive into the InterSystems Kubernetes Operator, a special controller for Kubernetes that streamlines InterSystems IRIS deployments and management. It's the easiest way to deploy an InterSystems IRIS cluster on-prem or in the Cloud, and we'll show how you can configure mirroring, ECP, sharding and compute nodes, and automate it all.

Finally, we'll discuss how to speed test InterSystems IRIS using the open source Ingestion Speed Test. This tool is available on InterSystems Open Exchange for your own testing and benchmarking.

4 6
1 524

Hi all.

A long time ago I enabled Activity Monitoring to be able to save myself headaches in the future when looking at the performance of various message routes through our productions. It's served it's purpose of answering questions on how many messages we process a week etc but I had not had the chance to really dig down into the stats for specific message types or destinations to pin point issues.

0 3
0 239

Hi Community!

The new video from Global Summit 2019 is already on InterSystems Developers YouTube:

System Alerting and Monitoring Made Easy

https://www.youtube.com/embed/XtXzvN3Gqgw
[This is an embedded link, but you cannot view embedded content directly on the site because you have declined the cookies necessary to access it. To view embedded content, you would need to accept all cookies in your Cookies Settings]

1 0
0 270

Hi Community,

The new video from Global Summit 2019 is already on InterSystems Developers YouTube:

⏯ Understanding System Performance Metrics

https://www.youtube.com/embed/4k9Qsc_HW7g
[This is an embedded link, but you cannot view embedded content directly on the site because you have declined the cookies necessary to access it. To view embedded content, you would need to accept all cookies in your Cookies Settings]

0 0
0 202

Off the back of the Interface Monitoring post I had created a class that queries the Ens.AlertRequest global and returns the entries between 6pm the night before and 6am in the morning.

I tested this build in our T&D environments and the build worked very well.

However in our production environment the query is being truncated, by what I believe to be a timeout and I get a partial query output.

In the System>SQL pages my 12 hour query times out.

0 5
0 203

The following steps show you how to display a sample list of metrics available from the /api/monitor service.

In the last post, I gave an overview of the service that exposes IRIS metrics in Prometheus format. The post shows how to set up and run IRIS preview release 2019.4 in a container and then list the metrics.


This post assumes you have Docker installed. If not, go and do that now for your platform :)

17 10
5 1.2K

Released with no formal announcement in IRIS preview release 2019.4 is the /api/monitor service exposing IRIS metrics in Prometheus format. Big news for anyone wanting to use IRIS metrics as part of their monitoring and alerting solution. The API is a component of the new IRIS System Alerting and Monitoring (SAM) solution that will be released in an upcoming version of IRIS.

11 2
7 1.8K

We are constantly running into issues where there are billions of Orphaned messages in our system that cause problems, and we have to manually run a cleanup to fix performance issues.

In the following article about orphaned messages... https://community.intersystems.com/post/ensemble-orphaned-messages it mentions either programmatically eliminating the Orphaned messages or using a Utility like Demo.Util.CleanupSet in ENSDEMO.

0 6
1 605

Hi all,

I recently discovered the Monitoring Activity Volume feature in IRIS and I was amazed by it. So, I put it to work in one of our productions. It is nice how easy it is to set up and all the possibilites that came with it.

But there's something weird: the numbers. Actually, one of the BP is stating a time of more than 6 seconds to process:

2 6
1 325

I'm a DBA and support Caché databases on AIX. I coded shell scripts for monitoring journaling status, databases size, license end date.

We recently got a new instance of Caché on Windows. I'm just curious to know whether anyone coded database monitoring scripts on Windows using PowerShell or any other scripting language.

If yes, please share the details.

Thanks & Regards,

Bharath Nunepalli.

0 3
0 443
Question
· Aug 13, 2019
Dashboard - Line Graph

Hello,

I want to create a dashboard with a line graph that shows system availability over time. I used this code to create a Dashboard:

            Set tItem = ##class(%DeepSee.UserLibrary.Link).%New()
                Set tItem.fullName = "Availability"
                Set tPage = "Availability.UI.CSVImport.zen"
                Set tItem.href = $system.CSP.GetPortalApp($namespace,tPage)_tPage
                Set tItem.title = "Availability"
                Set tSC = tItem.%Save()
0 7
0 285

I've setup ODBC connection so I can access Cache data within SQL Server.

I want to be able to write SQL queries for internal monitoring purposes, similar to what's possible with SQL Server. Specifically I want to be able to check mirroring status (i.e. check which is the current primary mirror member), check the status of any Ensemble productions (started/stopped), check the status of business hosts etc. I want to do all of this from SQL Server to go with our other system monitoring solutions.

0 1
0 274
Question
· Jul 16, 2019
Interface Monitoring

Hi all,

I'm looking to set up monitoring for several interfaces. I understand that I can set an Inactivity Timeout. However, obviously there are messages coming through more frequently during certain hours than other hours.

Is there a way to set an Inactivity Timeout for each hour of the day instead of one value that is used all day long?

Best,

Erin

0 12
3 687
Article
· Jul 12, 2019 2m read
Basic Database Metrics example

This is a self contained class that can be run from the Intersystems Task Scheduler which records peak usage details for databases and licenses built up throughout the day and retaining 30 days history.

To schedule the task to run every hour:

d ##class(Metrics.Task).Schedule()

You can also specify your own start time, stop time, and run interval:

d ##class(Metrics.Task).Schedule(startTime, stopTime, intervalMins)

Metrics are stored in ^Metrics in the namespace that the class resides in/is run from.

6 3
3 526
Article
· Feb 25, 2019 4m read
Using Grafana directly from IRIS

There have been some very helpful articles in the community that show how to use Grafana with IRIS (or Cache/Ensemble) by using an intermediate database.

But I wanted to get at IRIS structures directly. In particular, i wanted to access the Cache History monitor data that is accessible by SQL as described here

https://community.intersystems.com/post/apm-using-cach%C3%A9-history-mon...

and didn't want anything between me and the data.

9 5
4 1.4K

In looking at the Production monitor within Ensemble, I was wondering if there is a way we could customize it for our use. I notice it is basically a dashboard.

For example I would only like to truly display those Services, Processes, and Operations that are truly in dire need of attention. The Monitor out of the box just seems too busy, and I would like to simplify it.

0 2
3 783

Hi All

I'm looking for the a simple-quick-easy solution to monitor a SQL table thought Ensemble.

I have a process that update a DataBase ,a scheduled task that runs every night (Not Ensemble)

In the end it updates a table (replica_status) with a new recored with two fileds: Id, DateTime

I looked around the community but didn't find an answerd case.

I'm thinking on a Task that will run a sql outboud adapter BO that checks that table and send a alert if no new record was created yesterday

is this the right approach or is there's a better solution?

0 5
0 375