I believe most of you have encounted this problem: a healthconnect/ensemble user get a slow response and ask measurement on how long it takes ensmeble to process this request, the ensemble 'activity data' gives no clue of the delay.

The reason is HealthConnect message measurement was based on ensemble message, which can’t give a correct answer on when ensmeble recevie the request and what time it send back response. when there is delay on inbound/outbound adpter, or csp gateway, there is no way to find out the delay from "activity data" .

0 1
0 306

When you have been using cubes for business intelligence in a namespace for some time, you may find that there are many cubes in the namespace, only some of which are actively being used. However, it can be difficult to tell which cubes users are or are not querying, and maintaining unused cubes can be costly both in terms of storage and of computation to keep them up to date. This article provides some suggestions and examples for monitoring which cubes are in active use, and for removing cubes that you determine are no longer necessary.

5 2
3 518

Hey Developers,

Please welcome the new video on InterSystems Developers YouTube:

System Alerting & Monitoring

https://www.youtube.com/embed/EYLHIEAxHLk
[This is an embedded link, but you cannot view embedded content directly on the site because you have declined the cookies necessary to access it. To view embedded content, you would need to accept all cookies in your Cookies Settings]

3 0
1 341

Whenever the Windows SNMP Service restarts, the snmpdbg log says the following.

16:58:25 :Debug tracing enabled for SNMP agent
16:58:25 :SnmpExtensionInit called, pid=4432, tid=12276
16:58:25 :CreateEvent for CacheSNMPTrap suceeded
16:58:25 :register Cache OID 1.3.6.1.4.1.16563.1
16:58:25 :Get all Cache configs ... 16:58:25 :found 1 configs
16:58:25 :Add ENSEMBLE config to list ...

0 4
0 553
Announcement
· Aug 20, 2020
SQL Monitoring survey

Hi,

As part of our continuous efforts to expand and improve the InterSystems IRIS Data Platform, we’ve set up a brief survey around SQL monitoring. Your feedback will help us in designing and developing the right tools for the job and improve the platform’s overall ease-of-use. Please use the link below to access the survey, which should only take around 5 minutes to complete.

0 0
0 234
Article
· Aug 2, 2020 1m read
Application Errors Analytics

Hi Developers!

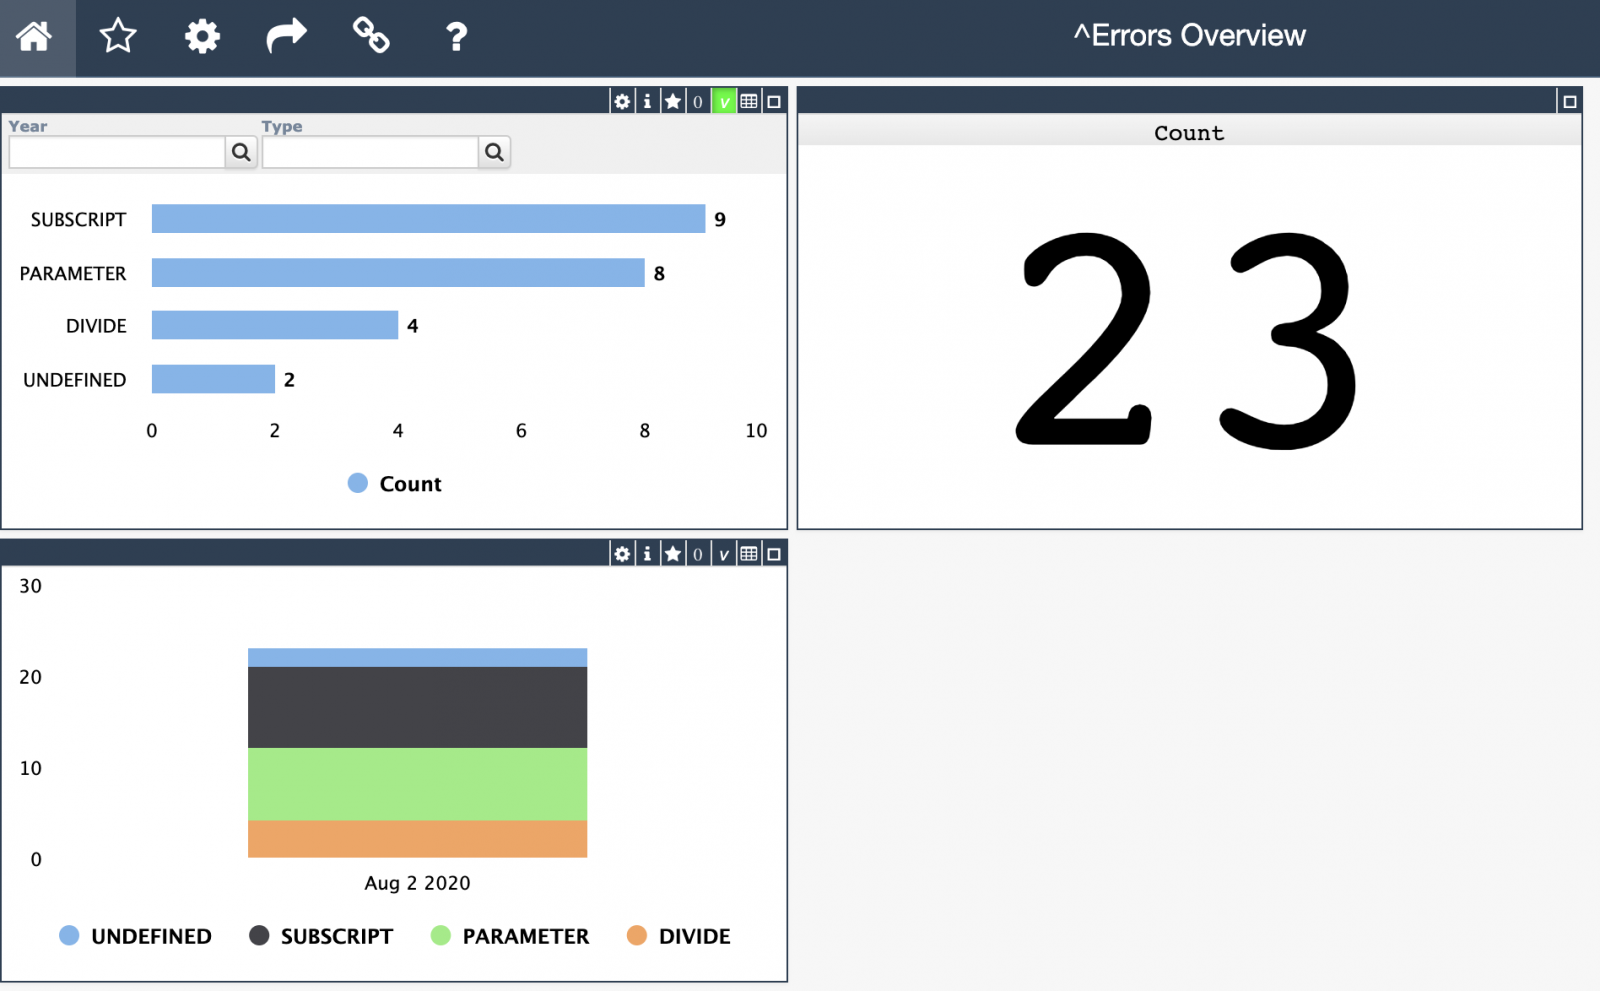
As you know the application errors live in ^ERRORS global. They appear there if you call:

d e.Log() 

in a Catch section of Try-Catch.

With @Robert.Cemper1003's approach, you can now use SQL to examine it.

Inspired by Robert's module I introduced a simple IRIS Analytics module which shows these errors in a dashboard:

3 5
1 351

Hey Developers,

Check out the latest video on FHIR API Management:

FHIR API Management: Basic Configuration

https://www.youtube.com/embed/EYZ4dXNZNSY
[This is an embedded link, but you cannot view embedded content directly on the site because you have declined the cookies necessary to access it. To view embedded content, you would need to accept all cookies in your Cookies Settings]

FHIR API Management: FHIR Dev Portal

https://www.youtube.com/embed/9yEm7ZAZENI
[This is an embedded link, but you cannot view embedded content directly on the site because you have declined the cookies necessary to access it. To view embedded content, you would need to accept all cookies in your Cookies Settings]

FHIR API Management: Logging and Monitoring

https://www.youtube.com/embed/xcHjcBTLw8o
[This is an embedded link, but you cannot view embedded content directly on the site because you have declined the cookies necessary to access it. To view embedded content, you would need to accept all cookies in your Cookies Settings]

FHIR API Management: Security

https://www.youtube.com/embed/7ImJPCdp96A
[This is an embedded link, but you cannot view embedded content directly on the site because you have declined the cookies necessary to access it. To view embedded content, you would need to accept all cookies in your Cookies Settings]

3 0
0 451

Hi All,

With this article, I would like to show you how easily and dynamically System Alerting and Monitoring (or SAM for short) can be configured. The use case could be that of a fast and agile CI/CD provisioning pipeline where you want to run your unit-tests but also stress-tests and you would want to quickly be able to see if those tests are successful or how they are stressing the systems and your application (the InterSystems IRIS backend SAM API is extendable for your APM implementation).

4 0
1 715

GA releases are now available for the first version (v1.0) of InterSystems System Alerting and Monitoring (InterSystems SAM for short)

InterSystems SAM v1.0 provides a modern monitoring solution for InterSystems IRIS based products. It allows high-level views of clusters and single-node drilled down metrics-visualization together with alerts notifications. This first version provides visualization for more than one hundred InterSystems IRIS kernel metrics, and users can extend the default-supplied Grafana template to their liking.

5 2
0 486

Hi,

During the implementation of iris-history-monitor using ZPM, I'm bumping on the following scenario:

My Installer.cls has a call for the Custom Sensors Class method. The Custom information looks like a charm as I described in this article:

IRIS History Monitor using custom built-in REST API /api/monitor/metrics

But, now I'm trying to replicate the same behavior using the module.xml to work with ZPM.

0 4
0 257

Preview releases are now available for the first version (v1.0) of InterSystems System Alerting and Monitoring (InterSystems SAM for short).

InterSystems SAM v1.0 provides a modern monitoring solution for InterSystems IRIS-based products. It allows high-level views of clusters and single-node drilled down metrics-visualization together with alerts notifications. This first version provides visualization for more than one hundred InterSystems IRIS kernel metrics, and users can extend the default-supplied Grafana template to their liking.

V1.0 is meant to be a simple and intuitive baseline. Please help us make it great by trying it and sending us feedback!

SAM can display information from InterSystems-based instance starting with version 2019.4

SAM is only available in container format. You will need the SAM Manager container plus a small set of additional open-source components (Prometheus and Grafana) that are added automatically by the composition file.

SAM components and the SAM Manager Community Edition are available from

If you are traveling or prefer a voice-based Q&A description on what SAM is, here is a podcast we have prepared for you:

https://5e18edf067eb59-03854285.castos.com/player/198587
[This is an embedded link, but you cannot view embedded content directly on the site because you have declined the cookies necessary to access it. To view embedded content, you would need to accept all cookies in your Cookies Settings]

7 2
2 819

Hey Developers,

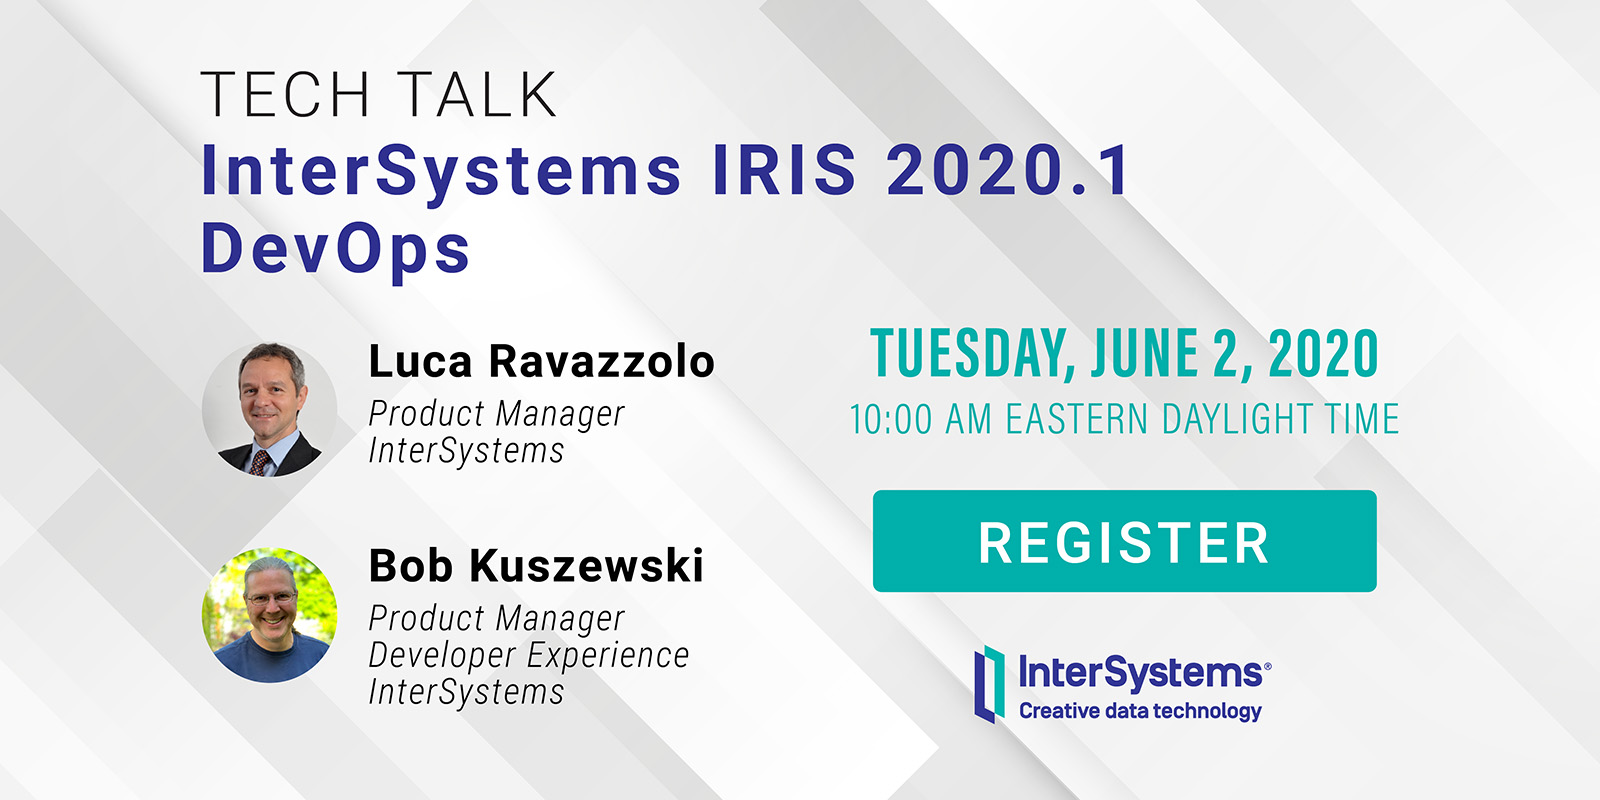
We're pleased to invite you to join the next InterSystems IRIS 2020.1 Tech Talk: DevOps on June 2nd at 10:00 AM EDT!

In this InterSystems IRIS 2020.1 Tech Talk, we focus on DevOps. We'll talk about InterSystems System Alerting and Monitoring, which offers unified cluster monitoring in a single pane for all your InterSystems IRIS instances. It is built on Prometheus and Grafana, two of the most respected open source offerings available.

Next, we'll dive into the InterSystems Kubernetes Operator, a special controller for Kubernetes that streamlines InterSystems IRIS deployments and management. It's the easiest way to deploy an InterSystems IRIS cluster on-prem or in the Cloud, and we'll show how you can configure mirroring, ECP, sharding and compute nodes, and automate it all.

Finally, we'll discuss how to speed test InterSystems IRIS using the open source Ingestion Speed Test. This tool is available on InterSystems Open Exchange for your own testing and benchmarking.

4 6
1 583

Hi all.

A long time ago I enabled Activity Monitoring to be able to save myself headaches in the future when looking at the performance of various message routes through our productions. It's served it's purpose of answering questions on how many messages we process a week etc but I had not had the chance to really dig down into the stats for specific message types or destinations to pin point issues.

0 3
0 290

Hi Community!

The new video from Global Summit 2019 is already on InterSystems Developers YouTube:

System Alerting and Monitoring Made Easy

https://www.youtube.com/embed/XtXzvN3Gqgw
[This is an embedded link, but you cannot view embedded content directly on the site because you have declined the cookies necessary to access it. To view embedded content, you would need to accept all cookies in your Cookies Settings]

1 0
0 318

Hi Community,

The new video from Global Summit 2019 is already on InterSystems Developers YouTube:

⏯ Understanding System Performance Metrics

https://www.youtube.com/embed/4k9Qsc_HW7g
[This is an embedded link, but you cannot view embedded content directly on the site because you have declined the cookies necessary to access it. To view embedded content, you would need to accept all cookies in your Cookies Settings]

0 0
0 250

Off the back of the Interface Monitoring post I had created a class that queries the Ens.AlertRequest global and returns the entries between 6pm the night before and 6am in the morning.

I tested this build in our T&D environments and the build worked very well.

However in our production environment the query is being truncated, by what I believe to be a timeout and I get a partial query output.

In the System>SQL pages my 12 hour query times out.

0 5
0 244

The following steps show you how to display a sample list of metrics available from the /api/monitor service.

In the last post, I gave an overview of the service that exposes IRIS metrics in Prometheus format. The post shows how to set up and run IRIS preview release 2019.4 in a container and then list the metrics.


This post assumes you have Docker installed. If not, go and do that now for your platform :)

18 10
6 1.5K

Released with no formal announcement in IRIS preview release 2019.4 is the /api/monitor service exposing IRIS metrics in Prometheus format. Big news for anyone wanting to use IRIS metrics as part of their monitoring and alerting solution. The API is a component of the new IRIS System Alerting and Monitoring (SAM) solution that will be released in an upcoming version of IRIS.

11 2
7 2.1K