InterSystems Business Intelligence enables you to embed business intelligence (BI) into your applications so that your users can ask and answer sophisticated questions of their data. Specifically, your application can include dashboards, which can include the following:
Interactive widgets that execute queries designed for specific user roles or for specific areas of your user interface.
Controls such as drop-down lists and data choosers that enable users to modify these queries.
Interactive drill options that enable users to view the displayed data in different ways.
Options to export, print, and send alerts to other users.
An option to launch the Mini Analyzer, which supports free-form analysis.
Execute custom actions that are provided as buttons or other controls.
In contrast to traditional BI systems that use static data warehouses, Business Intelligence is kept closely in synchronization with the live transactional data, as required for your business.
I'm using Git with DeepSee and when I need to do a commit to the git repo I'm exporting ALL the pivots and dashboards from the namespace. But I can forget to do that) And it can take time for a large system.
What is the way to manage automatical export of DeepSee artefacts which we are editing in UI (Cubes, Pivots, Dashboards, Pivot Variables, Term lists, Shared Measures) into files every time when I push Save button?
When creating a filter located on a dashboard that targets all, is there a way to narrow that filter down?
For example, in our data we have some dates that are well out of range due to data quality issues, but they still appear in the drop downs. Is there a way to say, only make available the below dates in the filter?
Another example, If we want to only look at Emergency data, it still provides all the wards for inpatient activity and activity in other hospitals, meaning, to get to just the Emergency wards you have to scroll through everything?
How to setup dollar ranges to get the number of patient accounts. So, I want to capture the number of patient accounts based on the original balance of:
0 to 499
500 to 999
1000 to 2499
5000 to 9999
10000 to 24999
25000 to 49999
50000 to 74000
75000 to 99999
I'm trying to immigrate some of my HealthInsight dashboards and pivot tables to another HS instance.
In some pivot tables, I defined them with a set of calculated dimensions defined in the analyzer, e.g as below:
Then when I exported the cubes and pivot tables in used to my new envirmonment. When I open my pivot tables again, the calculated dimensions are missing and hence my pivot tables no longer work:
This year while at the Global Summit, I came to learn of a component that Stephen Morrison of Intersystems had written that was capable of infusing SVG content into a PDF document. Apparently Stephen was approached about this and was amenable to sharing the code with us as we have recently encountered a similar need. I'm hoping this post will lead to the sharing of this utility code, so that we can determine if it will indeed suit our need.
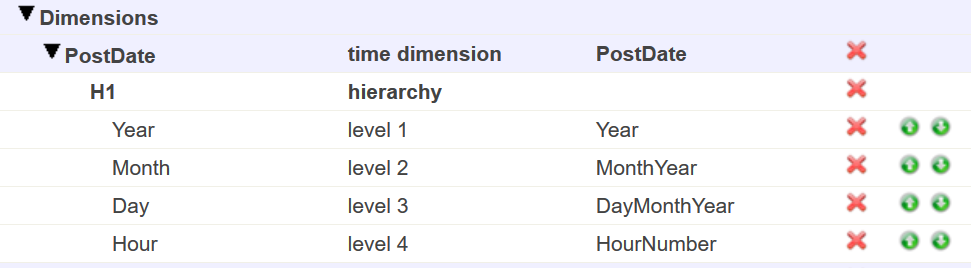
I have a server with rusw locale but in my cube the time dimension shows dates such as "JAN-2018". Is there a way to either localize that (preferably) or just output numbers like "01-2018"?
Architect:
Analyzer:
Also in architect, in level settings there is a "Time Format" property, what's that? Tried setting it to 3 but it didn't help.
Is it supported to be able to use member functions to define a set, in particular a set defined with a member range in the form:
set = member1:member2?
The docs only show hardcoded values being used for member1 and member2 and I can get it to work if I use hardcoded values. However if I try to use member functions it throws an error:
"ERROR #5001: Both parts of a range must be members"
I have a dashboard which shows the growth of the months compared with the month from the last year.
The way I found to develop that, it was with a kpi. So, I overrode the %OnLoadKPI method with two mdx:
SELECT NON EMPTY [DataD].[H1].[MothYear].Members ON ROWS, [Measures].[CountVisits] ON COLUMNS FROM SubjectAtendimento %FILTER [DataD].[H1].[Year].&[2016]
SELECT NON EMPTY [DataD].[H1].[MonthYear].Members ON ROWS, [Measures].[CountVisits] ON COLUMNS FROM SubjectAtendimento %FILTER [DataD].[H1].[Year].&[2015]
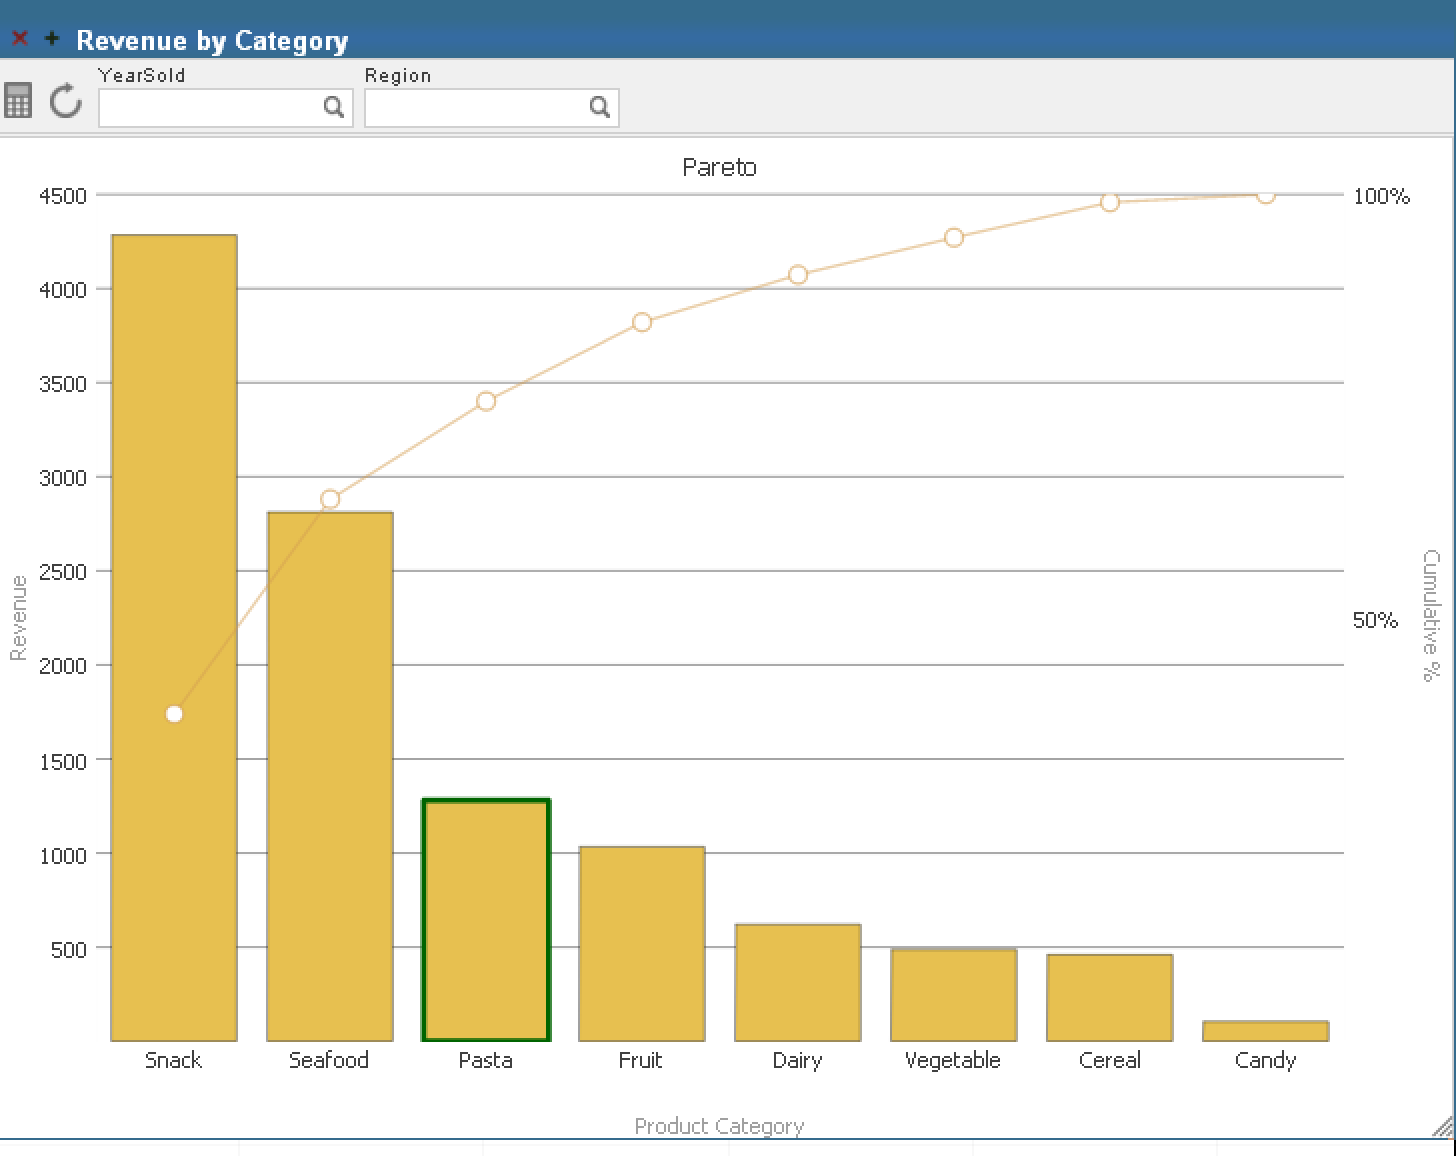
How can I create a calculated field that will give me the grand total of a column? For instance, if I have a row that has 200, 300, 500, 600, how do I get the Grand Total?
I have already used the wrench under Column Options as % of Total so, I can't use that option.
When I export the cube and the pivots that I made and import to another environment , the calculated metrics and dimension and also de pivot variable didn´t appear in the other environment. Because of this the pivot that use these metrics show error when you try to open.
I want to know that this behavior is normal or exist a way that you can export everything, independent if you build inside the cube or inside analyzer.
What would be the easiest or best way to filter the options presented by a filter control?
For example, suppose that I create a query using HoleFoods that uses a named filter to filter the product categories according to some criteria. When I display the query on the dashboard, I would like to provide a filter control that will allow users to further constrain the product categories. However, a simple filter control will display all the product categories available in the cube many of which are irrelevant to the current query.
According to the documentation (2016.1) we can use either a system defined web application (/api/deepsee) or create a custom web application for handling requests. What are some reasons to use one rather than the other?
 By views
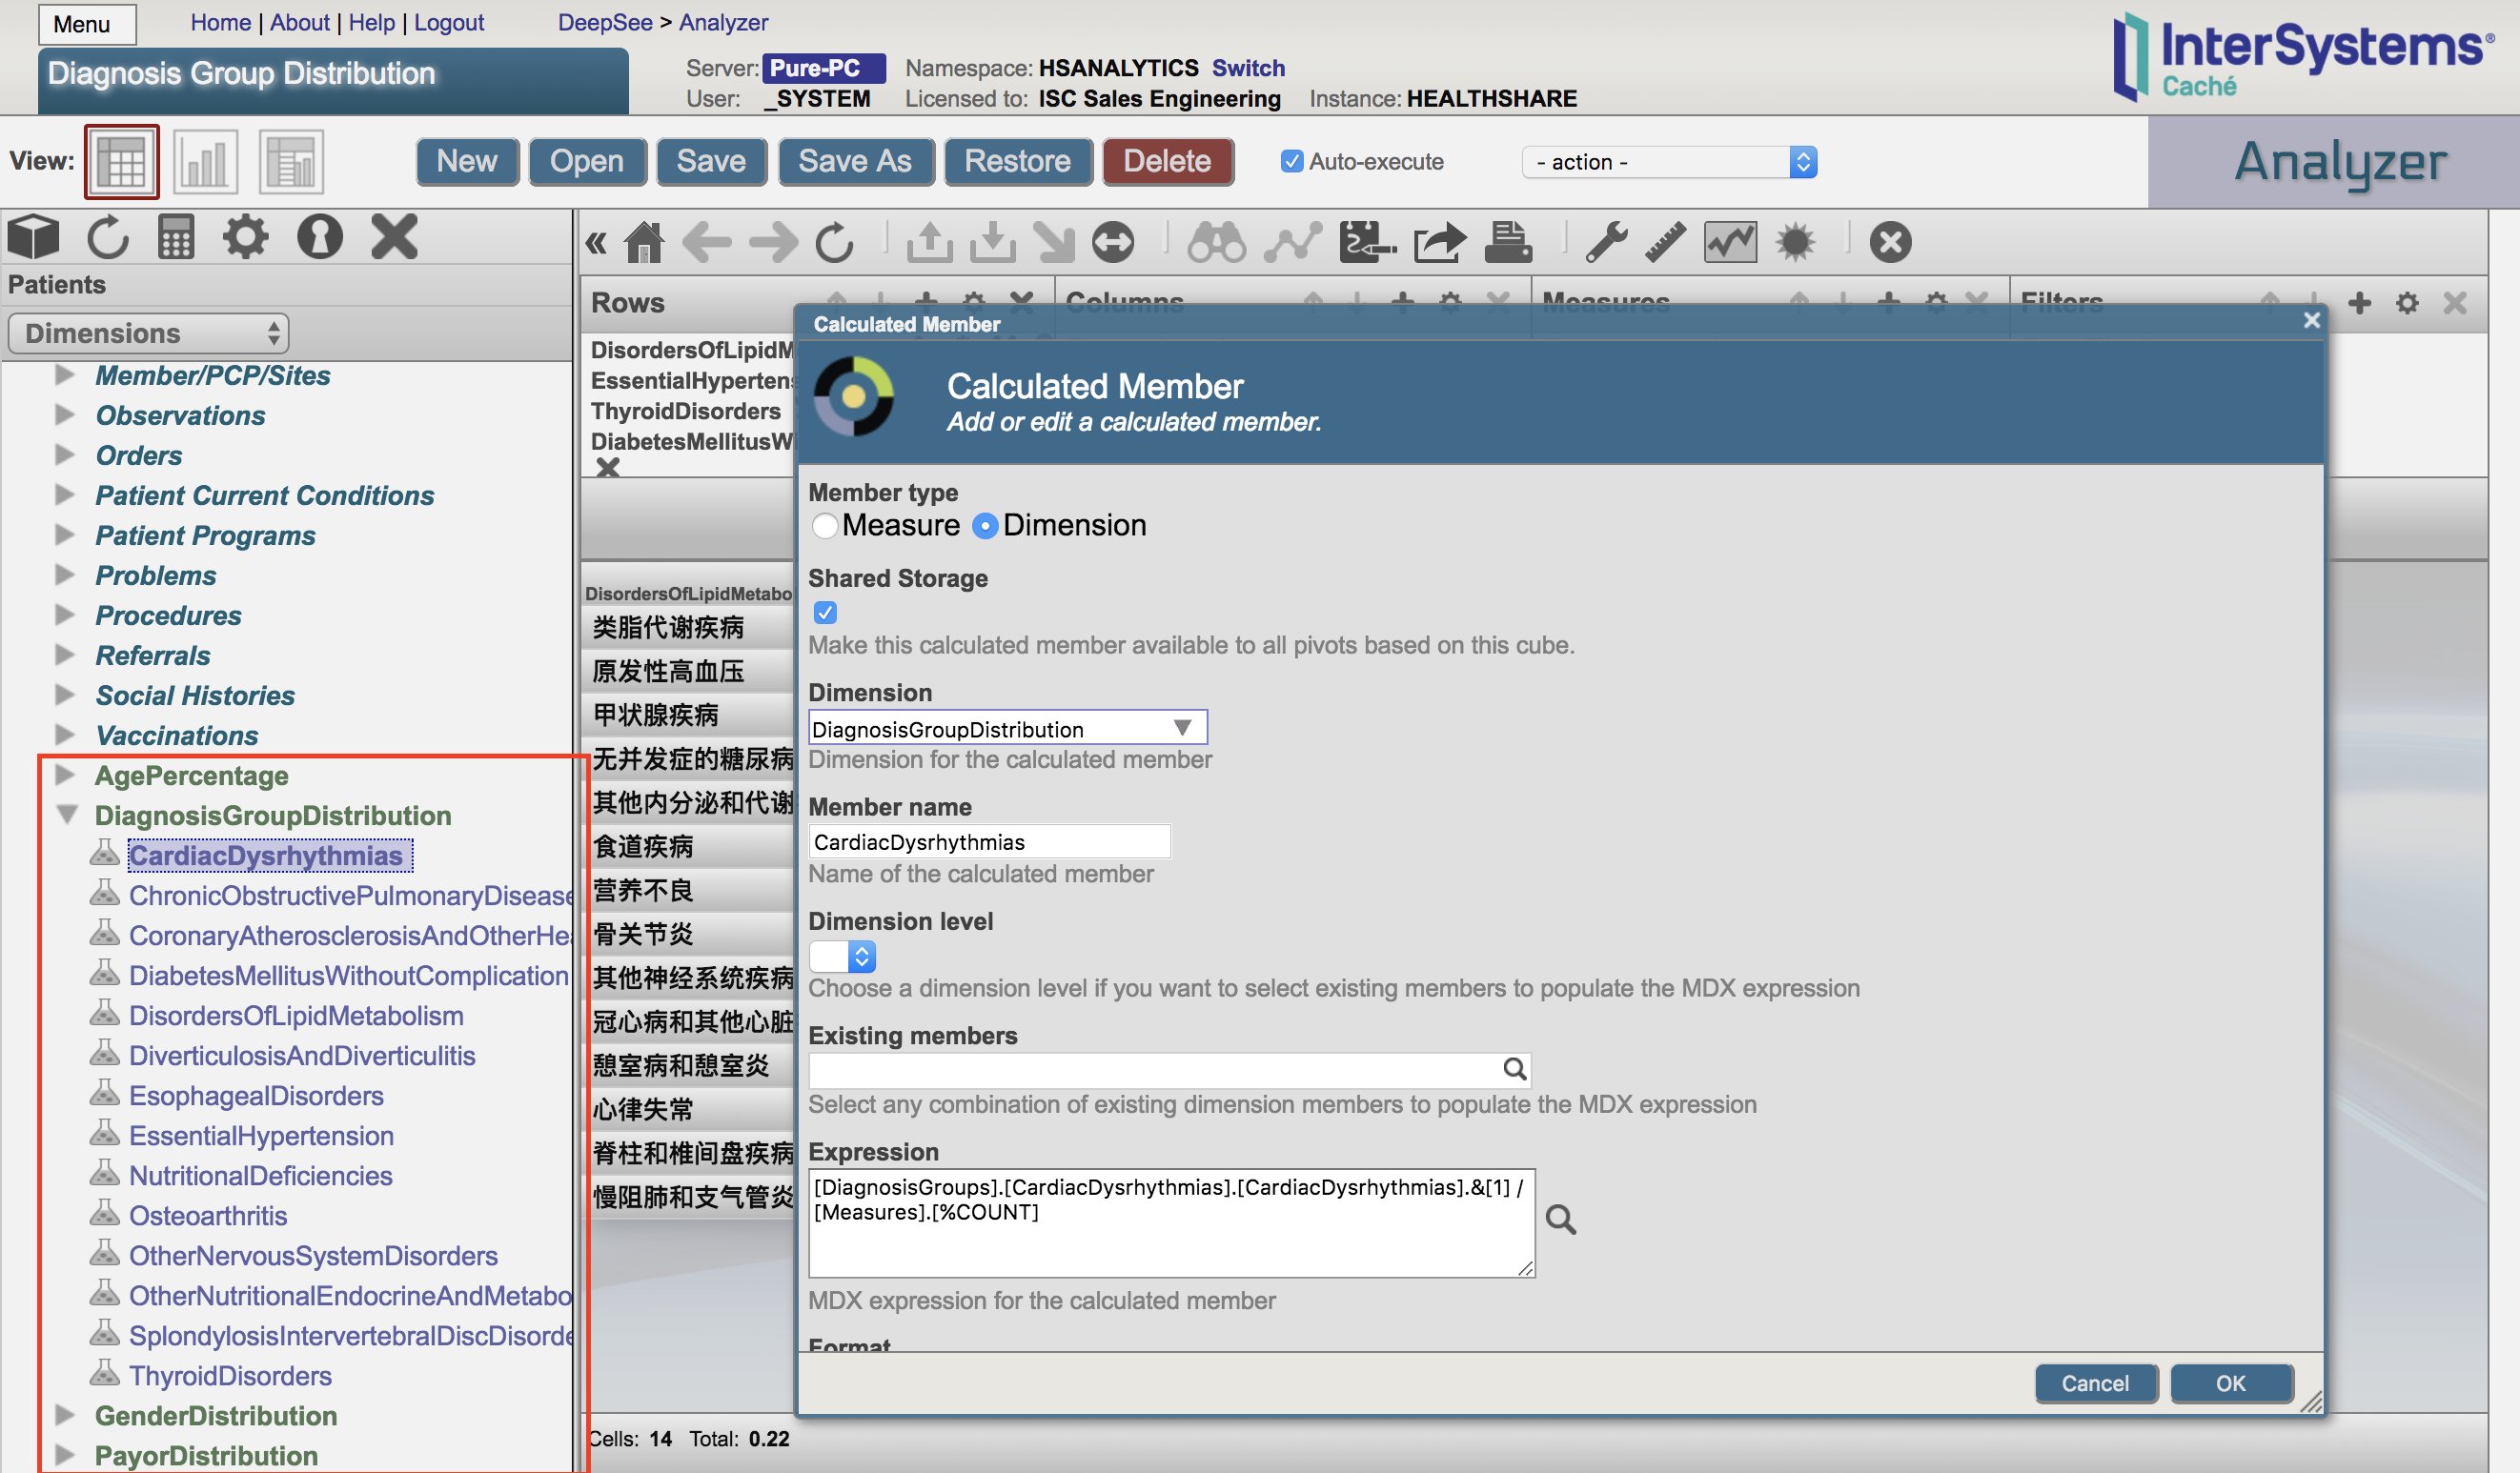
.png)