DeepSee: How to show the growth of a month compared with the month from the last year with Pivot
Hi all,
I have a dashboard which shows the growth of the months compared with the month from the last year.
The way I found to develop that, it was with a kpi. So, I overrode the %OnLoadKPI method with two mdx:
SELECT NON EMPTY [DataD].[H1].[MothYear].Members ON ROWS, [Measures].[CountVisits] ON COLUMNS FROM SubjectAtendimento %FILTER [DataD].[H1].[Year].&[2016]
SELECT NON EMPTY [DataD].[H1].[MonthYear].Members ON ROWS, [Measures].[CountVisits] ON COLUMNS FROM SubjectAtendimento %FILTER [DataD].[H1].[Year].&[2015]
And then, I set the %..data variable with the percent growth of the months for each year.
With kpi is very easy to do that, but, I wouldnt like to do that KPI. Instead, I would like to have a pivot, so t I need to have just one MDX.
Do you have any suggestion?
Comments
Documentation, Measures That Refer to Other Cells. There is an example in Samples which shows how to implement 'relative' measure: "Pareto Chart for Category" dashboard.
Hi!
You can make it with ParallelPeriod keyword.
F.e. let's take sales in Samples for the Holefoods cube.
To show YearToYear monthly growth in percent add in the pivot calculated measure "YTY growth" with expression:
(DateOfSale.CurrentMember-ParallelPeriod(DateofSale.YearSold,1,DateOfSale.CurrentMember))/ParallelPeriod(DateofSale.YearSold,1,DateOfSale.CurrentMember)
And format: ##.##%
How to use it.
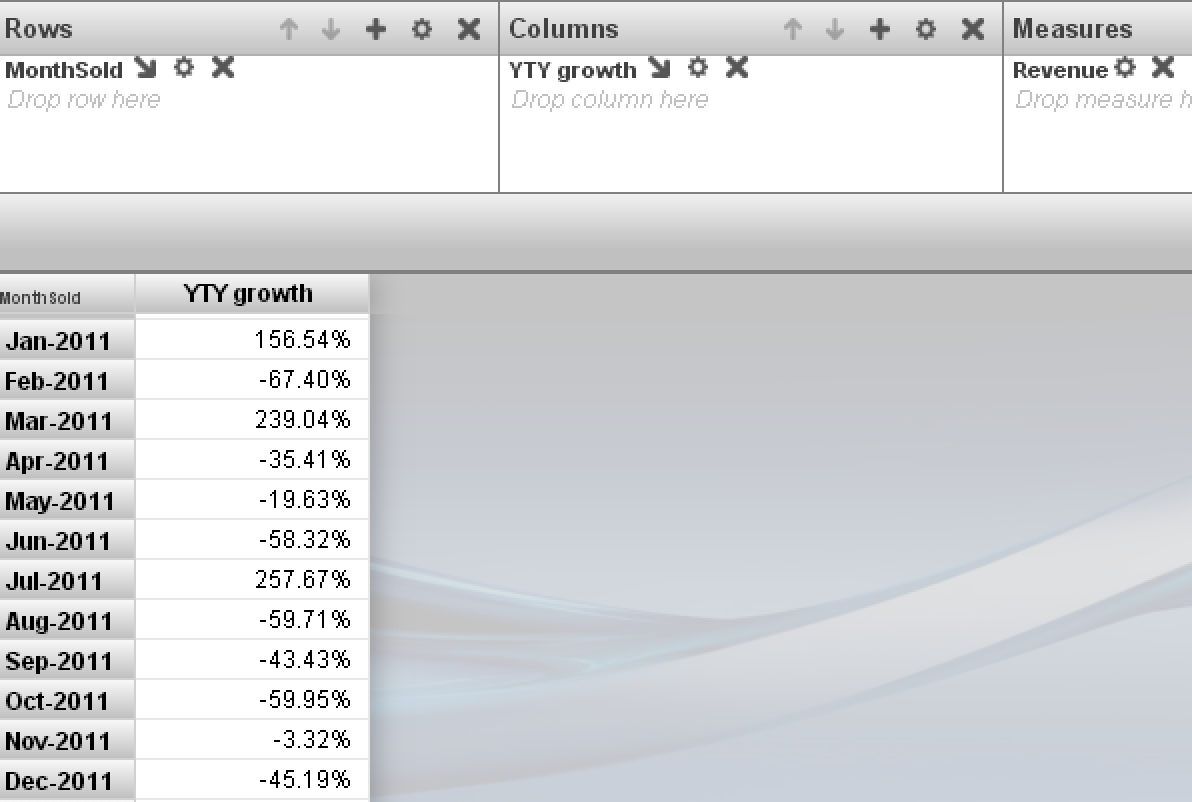
Place months in a pivot in Rows. Add YTY Calculated Measure to Cols. And add any Measure you want to compare into Measures, f.e. Revenue.
You'll get following MDX:
WITH MEMBER [DateOfSale].[SelectedYear] AS '[DateOfSale].[Actual].[YearSold].$VARIABLE.Year' MEMBER [MEASURES].[YTY growth] AS '(DateOfSale.CurrentMember-ParallelPeriod(DateofSale.YearSold,1,DateOfSale.CurrentMember))/ParallelPeriod(DateofSale.YearSold,1,DateOfSale.CurrentMember)',FORMAT_STRING='###.##%' SELECT NON EMPTY {[Measures].[%COUNT],[MEASURES].[YTY GROWTH]} ON 0,NON EMPTY [DateOfSale].[Actual].[MonthSold].Members ON 1 FROM [HoleFoods]
See the result:
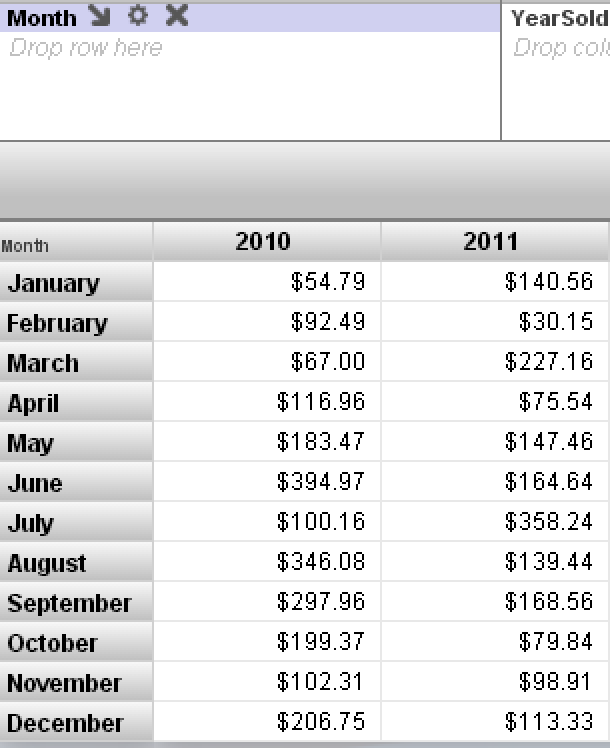
And here are 2011 and 2010 together to prove the measure above works properly:
Hope it helps.
Hi!
You can make it with ParallelPeriod keyword.
F.e. let's take sales in Samples for the Holefoods cube.
To show YearToYear monthly growth in percent add in the pivot calculated measure "YTY growth" with expression:
(DateOfSale.CurrentMember-ParallelPeriod(DateofSale.YearSold,1,DateOfSale.CurrentMember))/ParallelPeriod(DateofSale.YearSold,1,DateOfSale.CurrentMember)And format: ##.##%
How to use it.
Place months in a pivot in Rows. Add YTY Calculated Measure to Cols. And add any Measure you want to compare into Measures, f.e. Revenue.
You'll get following MDX:
WITH MEMBER [DateOfSale].[SelectedYear] AS '[DateOfSale].[Actual].[YearSold].$VARIABLE.Year' MEMBER [MEASURES].[YTY growth] AS '(DateOfSale.CurrentMember-ParallelPeriod(DateofSale.YearSold,1,DateOfSale.CurrentMember))/ParallelPeriod(DateofSale.YearSold,1,DateOfSale.CurrentMember)',FORMAT_STRING='###.##%' SELECT NON EMPTY {[Measures].[%COUNT],[MEASURES].[YTY GROWTH]} ON 0,NON EMPTY [DateOfSale].[Actual].[MonthSold].Members ON 1 FROM [HoleFoods]
See the result:
And here are 2011 and 2010 together to prove the measure above works properly:
Hope that helps.
Hi,
Thanks very much for the answers.
I tried parallelperiod and it worked for me.
The case where I filter for two years, the first year shows null values.
Is it possible to hide the null values?
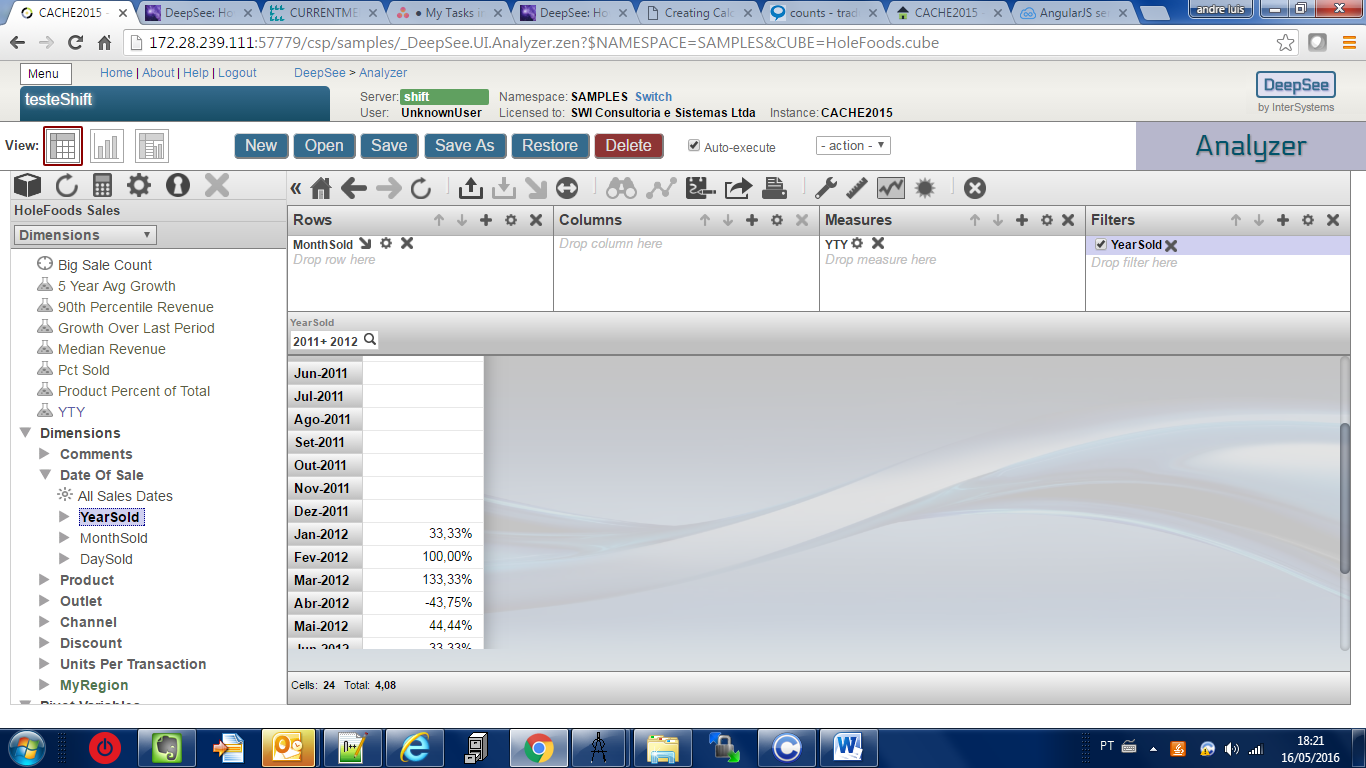
If you want just 2012, exclude 2011 from the filter - it will still show the percentage for 2012 related to 2011.
Or maybe I didn't get what pivot do you want?