By views
Hi, Community!
How can I manage to show in MDX query months where every month shows the value of the last month?
Say, in HoleFoods the query:
SELECT NON EMPTY [Measures].[Amount Sold] ON 0,NON EMPTY [DateOfSale].[Actual].[MonthSold].Members ON 1 FROM [HOLEFOODS]
will show me the sum of revenue per month.
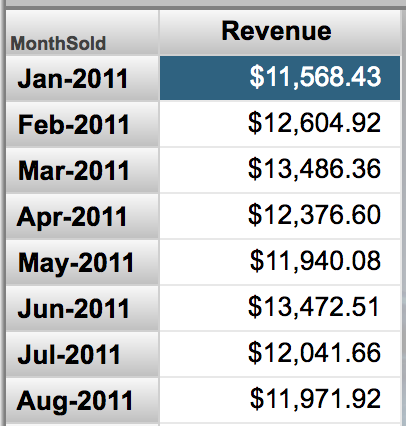
This query:


 Open Exchange app