My team and I noticed that the %ZEN class documentation labeled all properties and methods as deprecated.

Example: %ZEN.Auxiliary.altJSONProvider - InterSystems IRIS Data Platform 2024.1 - including private class members

In this regard, the big question is: what will be used to replace these methods, in particular %ZEN.Auxiliary.altJSONProvider?

1 20
2 490

There are several options how to deliver user interface(UI) for DeepSee BI solutions. The most common approaches are:

  • use native DeepSee Dashboards, get web UI in Zen and deliver it in your web apps.
  • use DeepSee REST API, get and build your own UI widgets and dashboards.

The 1st approach is good because of the possibility to build BI dashboards without coding relatively fast, but you are limited with preset widgets library which is expandable but with a lot of development efforts.

The 2nd provides you the way to use any comprehensive js framework (D3, Highcharts, etc) to visualize your DeepSee data, but you need to code widgets and dashboards on your own.

Today I want to tell you about yet another approach which combines both listed above and provides Angular based web UI for DeepSee Dashboards - DeepSee Web library.

3 16
5 2.4K
Article
· Oct 24, 2016 4m read
DeepSee Troubleshooting Guide

The goal of this “DeepSee Troubleshooting Guide” is to help you track down and fix problems in your DeepSee project.

If the problem can’t be fixed by following the guidelines, you will at least have enough information to submit a WRC issue with DeepSee Support and provide all the evidence to us, so we can continue the investigation together and resolve it faster!

13 16
1 2.7K

Hi colleagues!

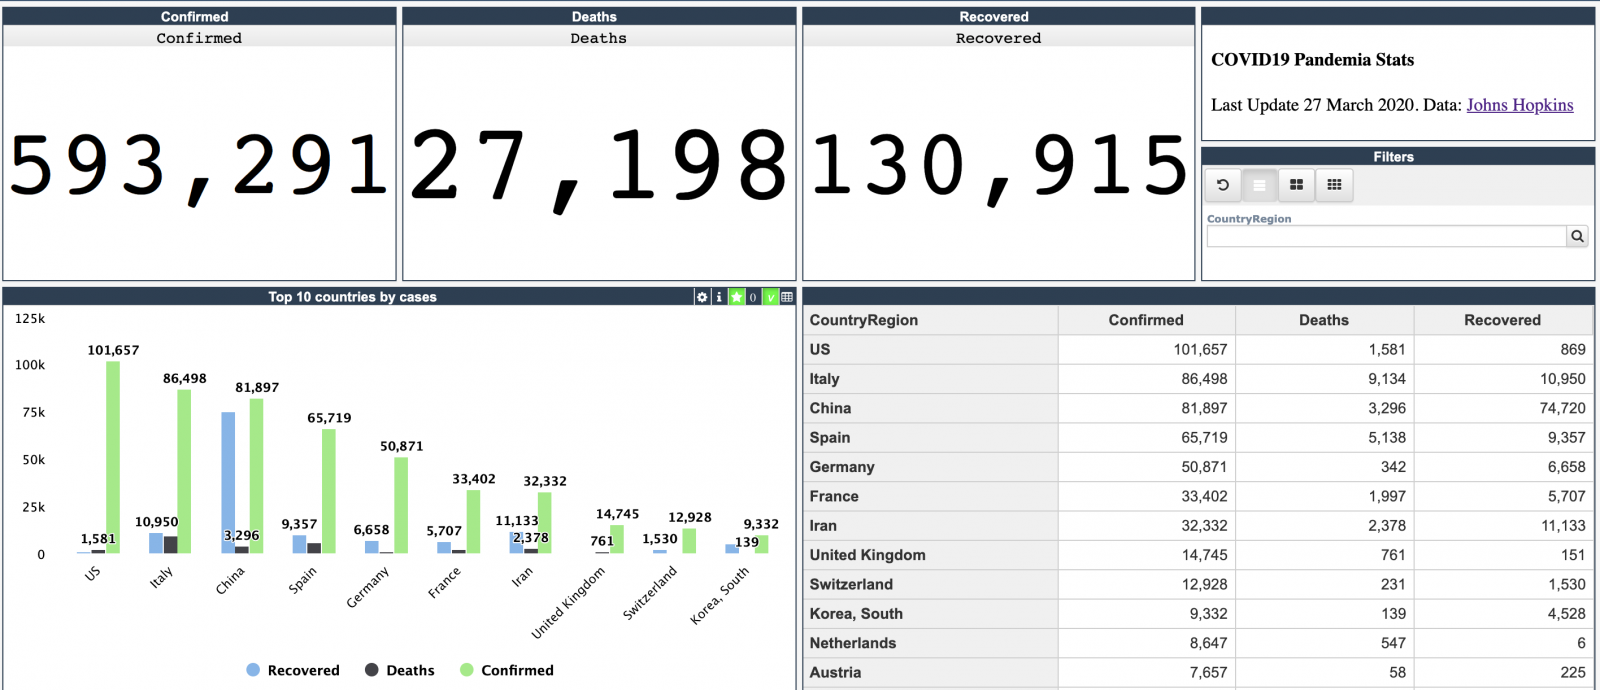
Every day Johns Hopkins University publishes new data on coronavirus COVID-19 pandemic status.

I built a simple InterSystems IRIS Analytics dashboard using InterSystems IRIS Community Edition in docker deployed on GCP Kubernetes which shows key measures of the disease outbreak.

This dashboard is an example of how information from CSV could be analyzed with IRIS Analytics and deployed to GCP Kubernetes in a form of InterSystems IRIS Community Edition.

Added the interactive map of the USA:

19 13
3 1K

My boss would like to change the Ensemble logo that one sees in the mangement portal, because it's part of the DeepSee Anaylzer.

I can see where it lives on the generated html.

I kow that you can set the logo for the User POrtal settings in DeepSee -- you can specifiy a URL for your logo. But we'd like to go one stee further and change the Ensemble by InterSystems to our own logo / company name.

Is it possible to change this in the code? Is there a Configuration setting to change this?

Thanks,

Laura

0 11
0 560

Hi Community,

I am using a method taht calls a Dashboard in Deepsee web from an application , but I want to know if it's possible to not showing the header, this part that have the search button, the name of the namespace, etc..

This is the method :

Method %OnAfterCreatePage() As %Status
{
//Set contratistaId = $Get(%session.Data("ContratistaId"),"")
//Set gerenciaId = $Get(%session.Data("GerenciaId"),"")

1 10
0 610

Hi All, We have been using DeepSee which has been the integrated Analytic Dashboard built over Cache Cubes. It works fine but it's visual capabilities are limited and most probably is getting phased out. If I am not wrong, Tableau is the suggested alternative to DeepSee . It is expensive and a big and considerable shift from existing technology I wanted to get an opinion of the community as to these few key points - What other BI tools others have been using with IRIS and what have been their experience - For which tools are the best inbuilt support / api's avaialble in IRIS

2 10
0 609
Question
· Mar 7, 2017
Grand Total

How can I create a calculated field that will give me the grand total of a column? For instance, if I have a row that has 200, 300, 500, 600, how do I get the Grand Total?

I have already used the wrench under Column Options as % of Total so, I can't use that option.

0 9
0 429

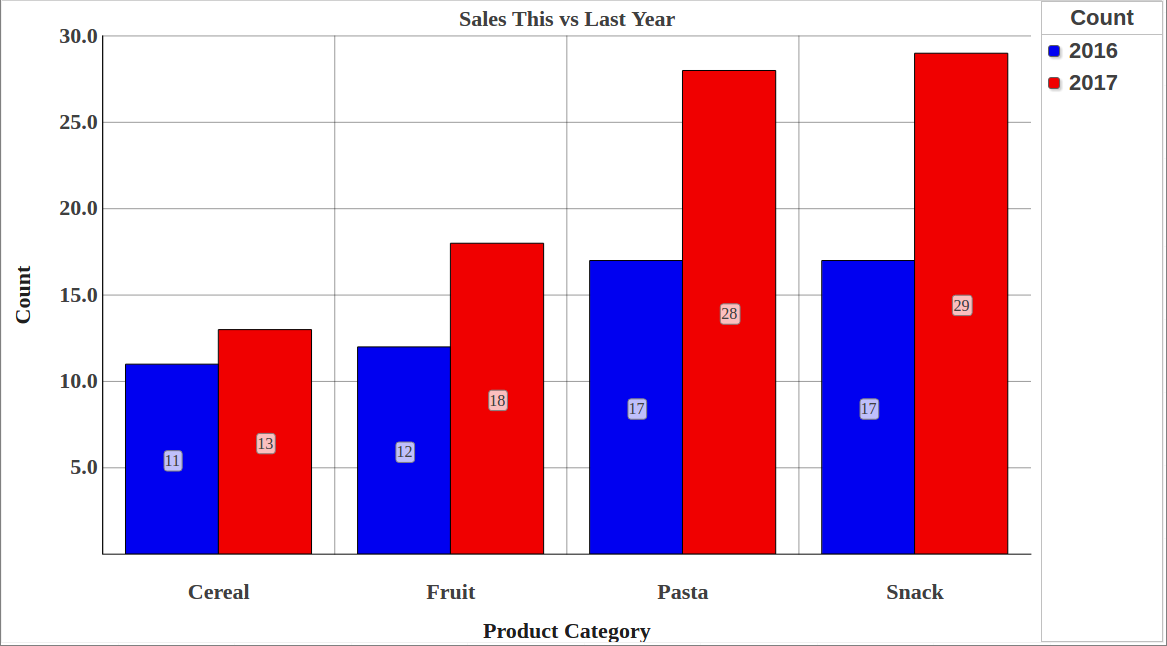
How are we doing THIS year versus the same period LAST year?
This is a common need in Business Intelligence. In fact, many design specifications for reports make use of a comparison between a selected period (year, quarter, etc) up to a certain date (for example November 15th, 2016) and a summary of the same information for the previous year (i.e. up to November 15th, 2015).
This post shows how to implement this in DeepSee.

6 8
0 1.9K

Those of you, who work with DeepSee, might have spotted, that when working with a date hierarchy, there are several functions, allowing you to select a time function for a given level. E.g. for extracting a year from a date/time property when building date hierarchy, you simply use Year function. similarly for month number, quarter and so on. Sometimes, you may wish to see the time - namely hour numbers. For this there is a HourNumber function available with DeepSee. Unfortunately, this function converts time into 12 hours format suffixed with AM/PM to indicate day part.

2 7
0 448
Question
· Aug 13, 2019
Dashboard - Line Graph

Hello,

I want to create a dashboard with a line graph that shows system availability over time. I used this code to create a Dashboard:

            Set tItem = ##class(%DeepSee.UserLibrary.Link).%New()
                Set tItem.fullName = "Availability"
                Set tPage = "Availability.UI.CSVImport.zen"
                Set tItem.href = $system.CSP.GetPortalApp($namespace,tPage)_tPage
                Set tItem.title = "Availability"
                Set tSC = tItem.%Save()
0 7
0 358