In the previous part of this series, we saw how to define a basic portlet. Now we will look into making this portlet reference a web page that will enhance our dashboard experience.

In this example, we will be embedding a Developer Community article along side a couple of widgets displaying information related to the number of views on the Developer Community articles. This example is not hosted on the Community Analytics server, but if it was we could see the view counts going up as we interacted with the page.

Why use this?

In a real case, perhaps you have an embedded page from an external web site showing the current Emergency Room wait times for Hospitals in your area. This portlet can be used along side widgets from your Emergency Room showing how many people are waiting, how many doctors are active, and how many people are being treated. As other Emergency Room wait times grow, you can possibly expect your volume to increase as well. This can help you make decisions on how to allocate resources.

1 0
0 369
Article
· Oct 27, 2016 1m read
Ensemble's Workflow Inbox portal

Hi - If you want to embed Ensemble's Workflow Inbox, (that offers workflow task items to workflow users) inside of your application - you can access the URL directly without necessarily giving users access to the Management Portal - but more importantly, you can strip away the Titlebar, Worklists and Borders that make up the page by default.

You do this by using the same URL parameters you would use, if embedding a regular DeepSee dashboard into your application.

For example, adding &EMBED=1 at the end of the URL as depicted below:

0 0
0 369
Article
· Aug 31, 2016 1m read
DeepSee cubes building troubleshooting

Hi!

Sometimes you see that call to DeepSee cube building method:

w ##class(%DeepSee.Utils).%BuildCube("CubeName")

does nothing.

Here are my 2 cents on possible reasons.

1. Run DeepSee Reset method in certain Namespace:

NAMESPACE> w ##class(%DeepSee.Utils).%Reset()

and try again.

2. Make sure, that all the indices in your base class for the cube are rebuilt, rebuild them and run it again:

1 2
0 369

Preview Mode was added to InterSystems IRIS Business Intelligence to give designers a quick view of what their resulting Pivot Table will look like without needing to wait for the results to fully execute. This can be beneficial when designing pivot tables because if you are dragging and dropping elements to see how they look/work in your pivot table and seeing if they have the desired data. Since you are exploring and designing, you don't necessarily care about the results at the moment, but you would still like to see how your table looks with the changes you have made.

2 0
0 356

I was approached recently by and end use who wanted to perform analysis of their databases and see how they could save some space by picking data good for deletion without harming the application. As part of investigation, they wanted to know sizes of globals within datasets. This can be achieved by various means but all of them provide data in text form only.

I thought I might be a good tool for database administrators in general - to see global sizes in a graphical way.

2 1
0 345
Article
· Aug 13, 2021 4m read
Building Analytics Solution with IRIS

Hi developers!

How to build an analytics solution with InterSystems IRIS?

To begin with, let's agree on the points of what is the analytics solution - and this could be a very wide topic. Let's limit the set of solutions to those you can present in the Analytics contest.

There are three kinds of analytics solutions that we will review here: monitoring, interactive analytics, and reporting.

Monitoring

The typical monitoring solution consists of an online dashboard with KPIs that are being actively updated.

The key use case is of monitoring is to visually observe the KPI of fresh data every moment to react in case of an emergency.

Interactive Analytics

This solution supposes a set of interactive dashboards with filters and drill-downs.

The key use case is to explore the data with filters and drill-downs making business decisions upon graph and table data visualization.

Reporting

Reporting solution provides a set of static (usually) reports in a form of HTML or pdf documents that deliver the data in graph and text form in a predesigned form and could be sent via email.

The typical use case of a reporting system is to obtain reports on a given period that will illustrate the status of the product, process, service, sales, etc that is crucial for the business.

How InterSystems products could be used to build such solutions? Let's discuss this below!

3 0
1 339

Hi Developers!

Many of you are looking for samples on how to work with InterSystems IRIS Analytics, formerly known as DeepSee.

There is a Samples BI module with Patients and Holefoods examples which is available on Github with source code. The installation steps are clear but take time.

Recently we added the option to run IRIS Community Edition containers with ObjectScript Package Manager (ZPM) on board. This simplifies the installation to the "run-one-command" step for the modules submitted to ZPM Community Registry. And thus we can benefit the Samples BI installation with ZPM.

And here is how you can run it on your laptop. Let's go!

1 1
0 336

Creating information dashboards, pivot tables, and widgets is an important step in analysis that provides valuable sources of information for informed decision-making. The IRIS BI platform offers many opportunities to create and customize these elements. In this article, we will take a closer look at the basic techniques for developing them and the importance of using them.

6 1
0 322

In the previous part of this series, we saw how to include data in a portlet from within DeepSee. This used the built in data controller. In this part, we are going to be pulling in data from outside of DeepSee. This will include both information from within InterSystems IRIS and from the OS.

Why use this?

This is useful if you would like to create a dashboard that only contains information about your system. It is also useful if you want to display data about your system along side data that you have stored in DeepSee.

2 0
0 313

What is Selective Build?

Selective Build is a BI feature in InterSystems IRIS (introduced in version 2020.1). Selective Build allows you to build specific elements of your cube while keeping your cube online.

What is special about Selective Build?

Before getting into the details of Selective Build, a brief recap of the different phases during a regular cube build is important. Here are the phases in a regular cube build:
1) Delete existing data in cube
2) Populate cube with full set of data
3) Build all indices in the cube

0 0
0 305

Previously I have already tried to play with Google Data Studio when I connected it to InterSystems FHIRaaS. It has quite a nice UI, with a few chart types available out of the box, it can be quite easily connected to some plain tables (stored as CSV or JSON, for instance), and gives the ability to build quite flexible analytics over it. So, I have decided to implement a new connector to InterSystems Analytics (DeepSee), with the ability to select a cube and do some queries on it.

3 0
0 301
Article
· Aug 2, 2020 1m read
Application Errors Analytics

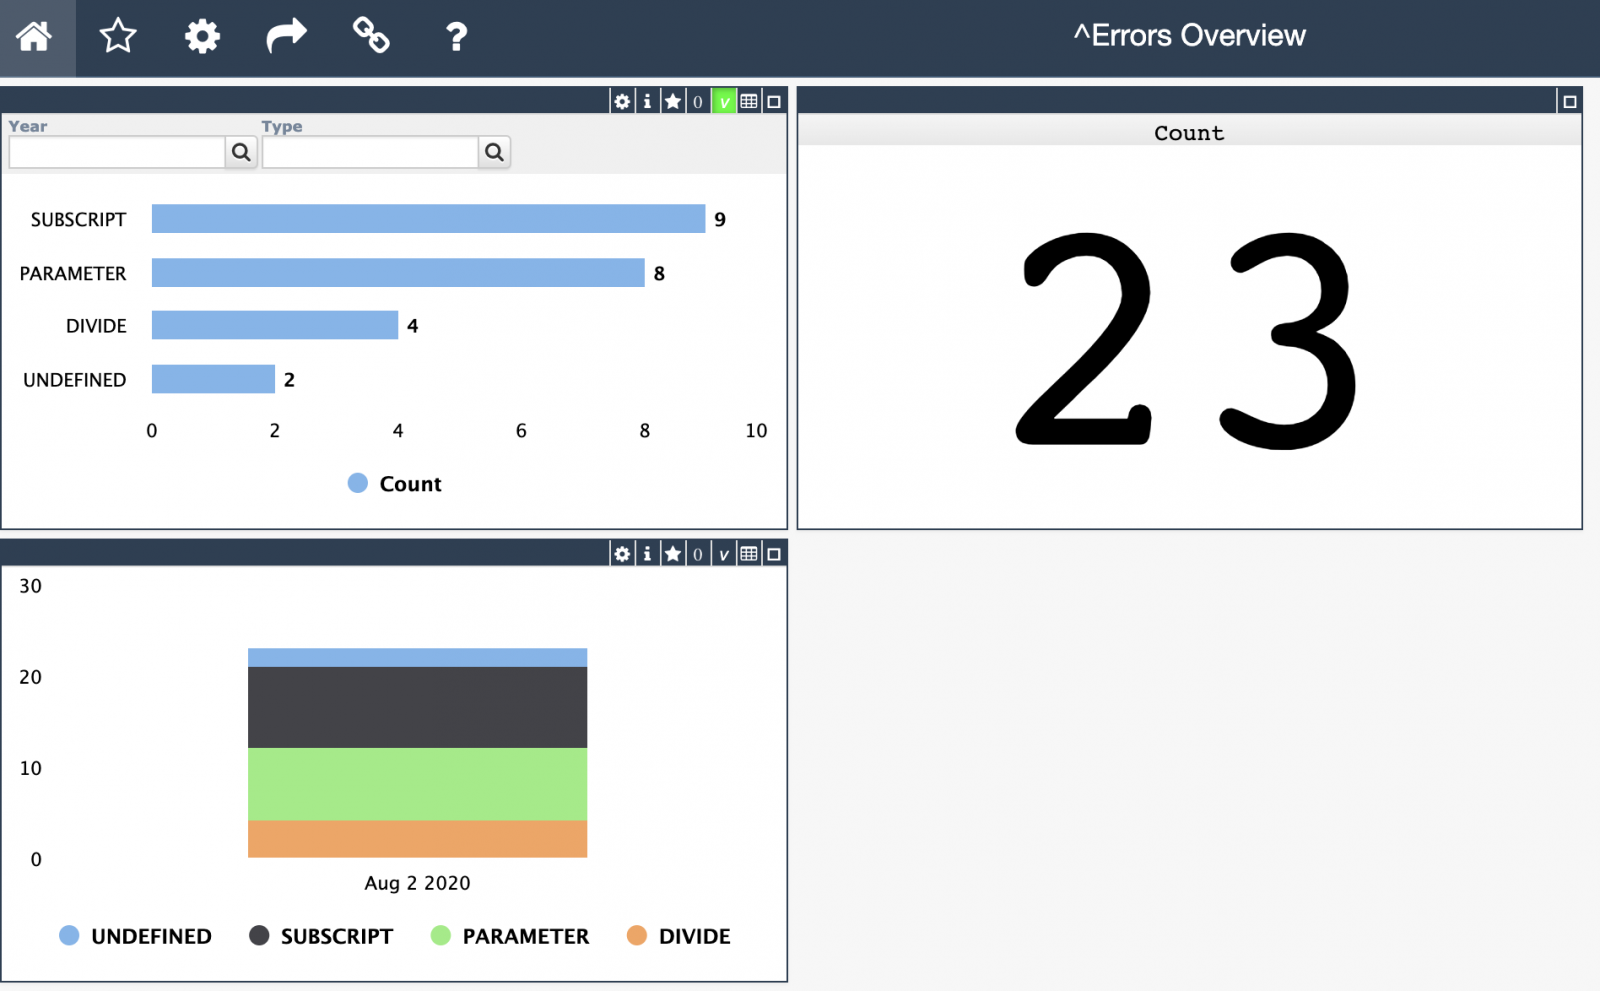
Hi Developers!

As you know the application errors live in ^ERRORS global. They appear there if you call:

d e.Log() 

in a Catch section of Try-Catch.

With @Robert Cemper's approach, you can now use SQL to examine it.

Inspired by Robert's module I introduced a simple IRIS Analytics module which shows these errors in a dashboard:

3 5
1 295

Hi guys.

Recently, I get interest in FHIR in order to run for the IRIS for Health FHIR
contest
. As a beginner on this topic, I've heard somewhat about it, but I didn't know how complex and powerful was FHIR. As pointed out by @Henrique Dias here, you can model several aspects of the patient history and other related entities.

4 5
0 292
Article
· May 28, 2016 3m read
DeepSee Listing Groups

This article is about DeepSee Listing Groups, a new DeepSee feature that was introduced in release 2015.2.

DeepSee Listings have always been a part of DeepSee. DeepSee Listing Groups provide increased flexibility by allowing you to create new DeepSee Listings without modifying the cube definition.

3 3
0 268
Article
· Sep 9, 2022 1m read
DC Analytics Open Application

InterSystems Developer Community analytics. Project made with InterSystems IRIS BI (DeepSee), Power BI and Logi Report Designer to visualize and analyze members, articles, questions, answers, views and other pieces of content and activity on InterSystems Developer Community.

You can see your own activity, articles and questions. Track how your contribution changes developer community.

2 0
0 257

When analyzing data, there is often a need to look at specific indicators more thoroughly and to highlight sections of information of particular interest to a user.

For instance, examining the data dynamics for specific regions or dates can help us uncover some hidden trends and patterns that will allow us to make an informed decision about our project in the future.

1 0
1 255

Presenter: André Cerri
Task: Use third-party visualization tools to present your DeepSee data
Approach: Use DeepSee REST services to access DeepSee data from third-party tools

Come see examples of how you can use popular 3rd party data visualization tools to access your DeepSee data.

Content related to this session, including slides, video and additional learning content can be found here.

0 0
0 247

In this article, we will explore the use of parameters, formulas and labels in Logi Report Designer (formerly Logi JReport Designer). What are they for and how to create them?

Using the basic functionality of InterSystems Reports Designer, parameters, formulas and labels, you can significantly improve the detail and information content of the generated report. In addition, these tools allow you to automate some of the processes, which greatly speeds up and facilitates the creation of reports.

Let's analyze each tool separately now.

4 2
0 245

Presenter: Joe Gallant
Task: Create a good analytical data model
Approach: Discuss what makes a good analytical data model. Provide examples of using DeepSee’s APIs for building custom dimensions, measures, and KPIs

Data models are the foundation of effective analytics. This session focuses on the factors that make good analytics data models.

Content related to this session, including slides, video and additional learning content can be found here.

0 1
0 243

Hi Developers!

Often solutions with InterSystems IRIS BI can turn into a quite big solution with dozens of pivots and dashboards.

With every new IRIS BI solution release we can add changes that could influence the behavior of existing pivots or dashboards so they stop working. For example if we change the dimension or measure name, forget deploying some cubes or subject areas, conduct refactoring via mass renaming of cubes and its elements etc some widgets could stop functioning.

6 3
1 232
Article
· Sep 11, 2021 5m read
iris-analytics-for-money

I regret getting a late start in the InterSystems Analytics contest. I had tried a couple of times before to use Analytics, but I had not gotten too far. I have been recording financial transactions in Excel workbook ever since I had to retire Microsoft Money. Since my iris-for-money was not fully functional, I created a worksheet per account I was tracking. I had developed a CSP page in iris-for-money to import transactions by reading a CSV file.

8 1
0 223
Article
· Feb 7, 2023 3m read
IRIS Queue monitoring component

1. Overview

With more and more hospital applications built, business interface data processing may be affected by a variety of factors (network, consumer systems, etc.), there is an excessive accumulation of messages or even cause interface lag, affecting the routine performance of hospital IT systems , so the monitoring of the business interface components queue is increasingly important.

While current Intersystems IRIS platform's built-in queue monitoring only displays real-time queue information for interface components, which is limited in providing the queue data information needed by hospitals. The queue monitoring component program is based on the Intersystems IRIS platform and can monitor all interface components and display component queue information within 24h of the component, as well as query component historical queue data by setting a time period to better meet the needs of current in-hospital applications.

4 1
0 219
Article
· Dec 31, 2019 3m read
Portlets that use data from DeepSee


In the previous part of this series, we saw how to reference a web page that will enhance our dashboard experience. Now we will look into referencing data that is already in our cubes.

In this example, we will be referencing the controller object and we will be extracting data from it. This data will then be displayed as text in our Dashboard. In Part 5, we will show how to incorporate this data into other charting libraries.

2 0
0 215

When we work with IRIS, we usually have the ability to quickly deploy a ready-to-use infrastructure for BI (data, analytical cubes, and IRIS BI dashboards) using modules. When we start using Adaptive Analytics, we typically want to have the same functionality. Adaptive Analytics has all the tools that we need. The documentation contains a description of how to work with an open web API. All interactions between the user interface and the engine also occur via the internal web API and can be emitted.

2 0
0 202