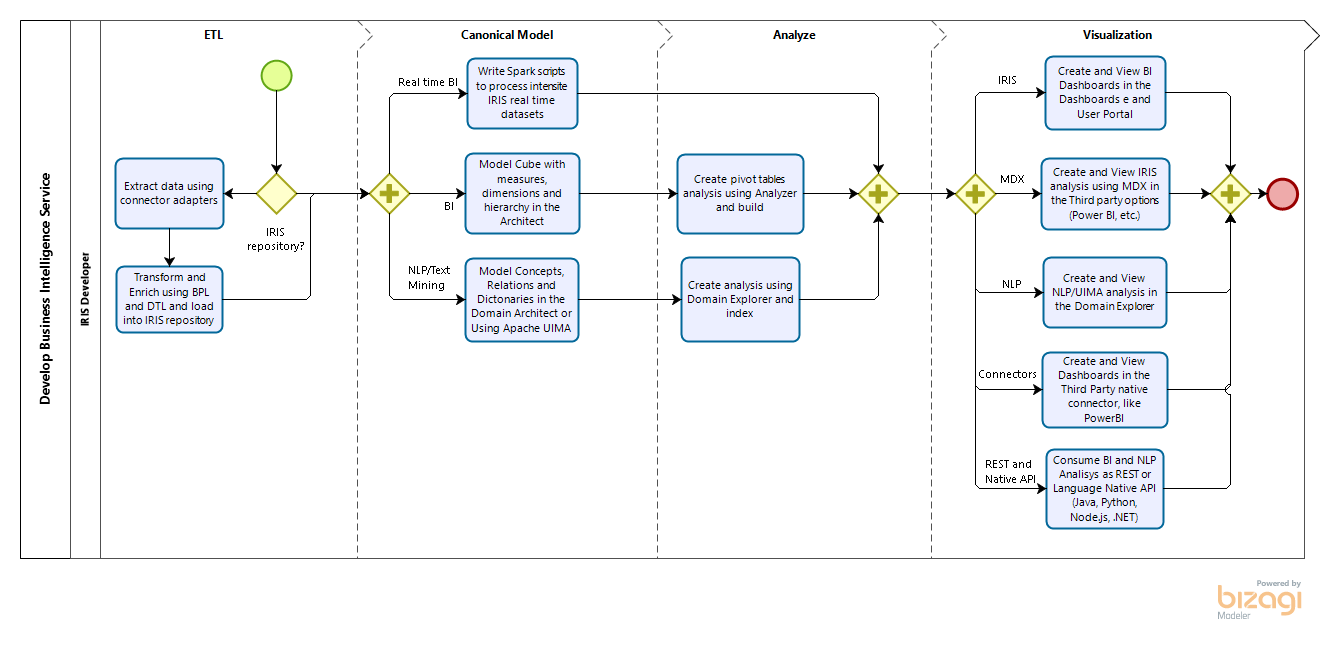
This tag relates to the discussions on the development of analytics and business intelligence solutions, visualization, KPI and other business metrics management.
How to use the IRIS Native API in Python to access globals and plot some charts.
Why Python?
With a large adoption and use in the world, Python have a great community and a lot of accelerators | libraries to deploy any kind of application.
If you are curious (https://www.python.org/about/apps/)
See how cubes are constructed for use in business intelligence, and learn about SQL and MDX query languages. Physical and virtual cubes are used in InterSystems IRIS® Business Intelligence and Adaptive Analytics:
AnalyzeThis is a tool for getting a personalized preview of your own data inside of InterSystems BI. This allows you to get first hand experience with InterSystems BI and understand the power and value it can bring to your organization. In addition to getting a personalized preview of InterSystems BI through an import of a CSV file with your data, Classes and SQL Queries are now supported as Data Sources in v1.1.0!
According to IDC, more than 80% of information it is NoSQL, especially text into documents. When the digital services or applications not process all this information, the business lose. To face this challenge, it is possible use OCR technology. OCR uses machine learning and/or trained image patterns to transform image pixels into text. This is important, because many documents are scanned into images inside PDF, or many documents contains images with text inside. So OCR are an important step to get all possible data from a document.
Now available on Open Exchange is a library of third party charts available to use within DeepSee/InterSystems IRIS BI dashboards. To start, simply download and install, select the new portlet as the widget type, then select the chart type that you desire. If you don't find the type of chart you are looking for, you can easily extend the portlet to implement your desired chart type. These new chart types can be used within existing dashboards or you can create new dashboards using them.
When you have been using cubes for business intelligence in a namespace for some time, you may find that there are many cubes in the namespace, only some of which are actively being used. However, it can be difficult to tell which cubes users are or are not querying, and maintaining unused cubes can be costly both in terms of storage and of computation to keep them up to date. This article provides some suggestions and examples for monitoring which cubes are in active use, and for removing cubes that you determine are no longer necessary.
In our latest episode of Data Points, @Brenna Quirk and I had a conversation with @Benjamin De Boe about the all-new columnar storage feature in InterSystems IRIS. Benjamin tells us a bit about what columnar storage is, why it's important for InterSystems IRIS users running analytical queries, and how you can learn more. Take a listen!
There are several options how to deliver user interface(UI) for DeepSee BI solutions. The most common approaches are:
use native DeepSee Dashboards, get web UI in Zen and deliver it in your web apps.
use DeepSee REST API, get and build your own UI widgets and dashboards.
The 1st approach is good because of the possibility to build BI dashboards without coding relatively fast, but you are limited with preset widgets library which is expandable but with a lot of development efforts.
The 2nd provides you the way to use any comprehensive js framework (D3, Highcharts, etc) to visualize your DeepSee data, but you need to code widgets and dashboards on your own.
Today I want to tell you about yet another approach which combines both listed above and provides Angular based web UI for DeepSee Dashboards - DeepSee Web library.
Do you want to reap the benefits of the advances in the fields of artificial intelligence and machine learning? With InterSystems IRIS and the Machine Learning (ML) Toolkit it’s easier than ever.
Join InterSystems Sales Engineers, @Sergey Lukyanchikovand @Eduard Lebedyuk, for the Machine Learning Toolkit for InterSystems IRIS webinar on Tuesday, April 23rd at 11 a.m. EDT to find out how InterSystems IRIS can be used as both a standalone development platform and an orchestration tool for predictive modelling that helps stitch together Python and other external tools.
Following up the previous part, it's time to take advantages for IntegratedML VALIDATION MODEL statement, to provide information in order to monitor your ML models. You can watch it in action here
I was using PowerBI to create regular display data obtained from one popular web sourse with hundreds of thousands of visitors per month and a big number of users.
At the beginning of that visualisation development, I was using direct connection from Power BI to Adaptive Analytics powered by AtScale. Adaptive Analytics is useful for cached data, aggregates and fast data sources switching between development and stage phases. The “AtScale cubes'' connection method was used:
The release of InterSystems IRIS 2021.1 introduces Adaptive Analytics. To get started with a familiar InterSystems IRIS BI sample cube, we have created a HoleFoods Sample Application for Adaptive Analytics. This Sample Application is available on Open Exchange. There is also a learning services course available to learn more about Adaptive Analytics.
I am planning to implement Business Intelligence based on the data in my instances. What is the best way to set up my databases and environment to use DeepSee?
Today we will talk about InterSystems Reports. This is a BI system that provides you with tools to create static reports and export them to different file formats. We will see how it works using the DC Analytics public analytical sample as an example. In this article, we will examine how to familiarize yourself with the reports available in the repository, how to make a new report based on a ready-made data structure, and how to prepare a data structure from scratch.
The following post is a guide to implement a basic architecture for DeepSee. This implementation includes a database for the DeepSee cache and a database for the DeepSee implementation and settings.
When using Related Cubes in InterSystems IRIS BI, cubes must be built in the proper order. The One side must be built before the Many side. This is because during build time for the Many side, it looks up the record on the One side and creates a link. If the referenced record is not found on the One side, a Missing Relationship build error is generated. The One side is going to be the independent side of the relationship, AKA the side of the relationship that is referenced by the Many side or the Dependent cube. For example: Patients contain a reference to their Doctor.
In this first installment of InterSystems IRIS 2020.1 Tech Talks, we put the spotlight on data science, machine learning (ML), and analytics. InterSystems IntegratedMLTM brings automated machine learning to SQL developers. We'll show you how this technology supports feature engineering and chooses the most appropriate ML model for your data, all from the comfort of a SQL interface. We'll also talk about what's new in our open analytics offerings. Finally, we'll share some big news about InterSystems Reports, our "pixel-perfect" reporting option. See how you can now generate beautiful reports and export to PDF, Excel, or HTML.
When we collect temporary data (the number of purchases in the store, the number of comments on the post), it may happen that there is no data for a certain period of time. In this case, this time period (hour, day, month) is not represented in the database, that is, there is not a single row for this period. In other words, there are no rows in the database for this period.
In our latest episode of Data Points, I had a conversation with @Thomas Dyarabout AI Link, which helps bridge the gap between data scientists and business analysts. Our conversation talks about how AI Link fits with IntegratedML and Adaptive Analytics, as well, as what new features are on the horizon for IntegratedML. Take a listen!
Today, is important analyze the content into portals and websites to get informed, analyze the concorrents, analyze trends, the richness and scope of content of websites. To do this, you can alocate people to read thousand of pages and spend much money or use a crawler to extract website content and execute NLP on it. You will get all necessary insights to analyze and make precise decisions in a few minutes.