Some Usage cases

1. A deployment may consist of two high availability instances and two disaster recovery instances in a different data center.

The corresponding UAT environment could replicate this giving a total of 8 instances. How do you confirm CPF and Scheduled task alignment across ALL instances.

3 2
0 319
Article
· Feb 3, 2023 3m read
Queue monitoring

Overview

With the gradual improvement of hospital information construction, there are more and more business interfaces in hospitals. Due to the influence of various factors (network, consumer system, etc.), the data processing of business interface may cause excessive message accumulation and even the situation of interface card congestion, which affects the normal business development in the hospital. Therefore, the monitoring of the queue of business interface components becomes more and more important.

3 2
0 378

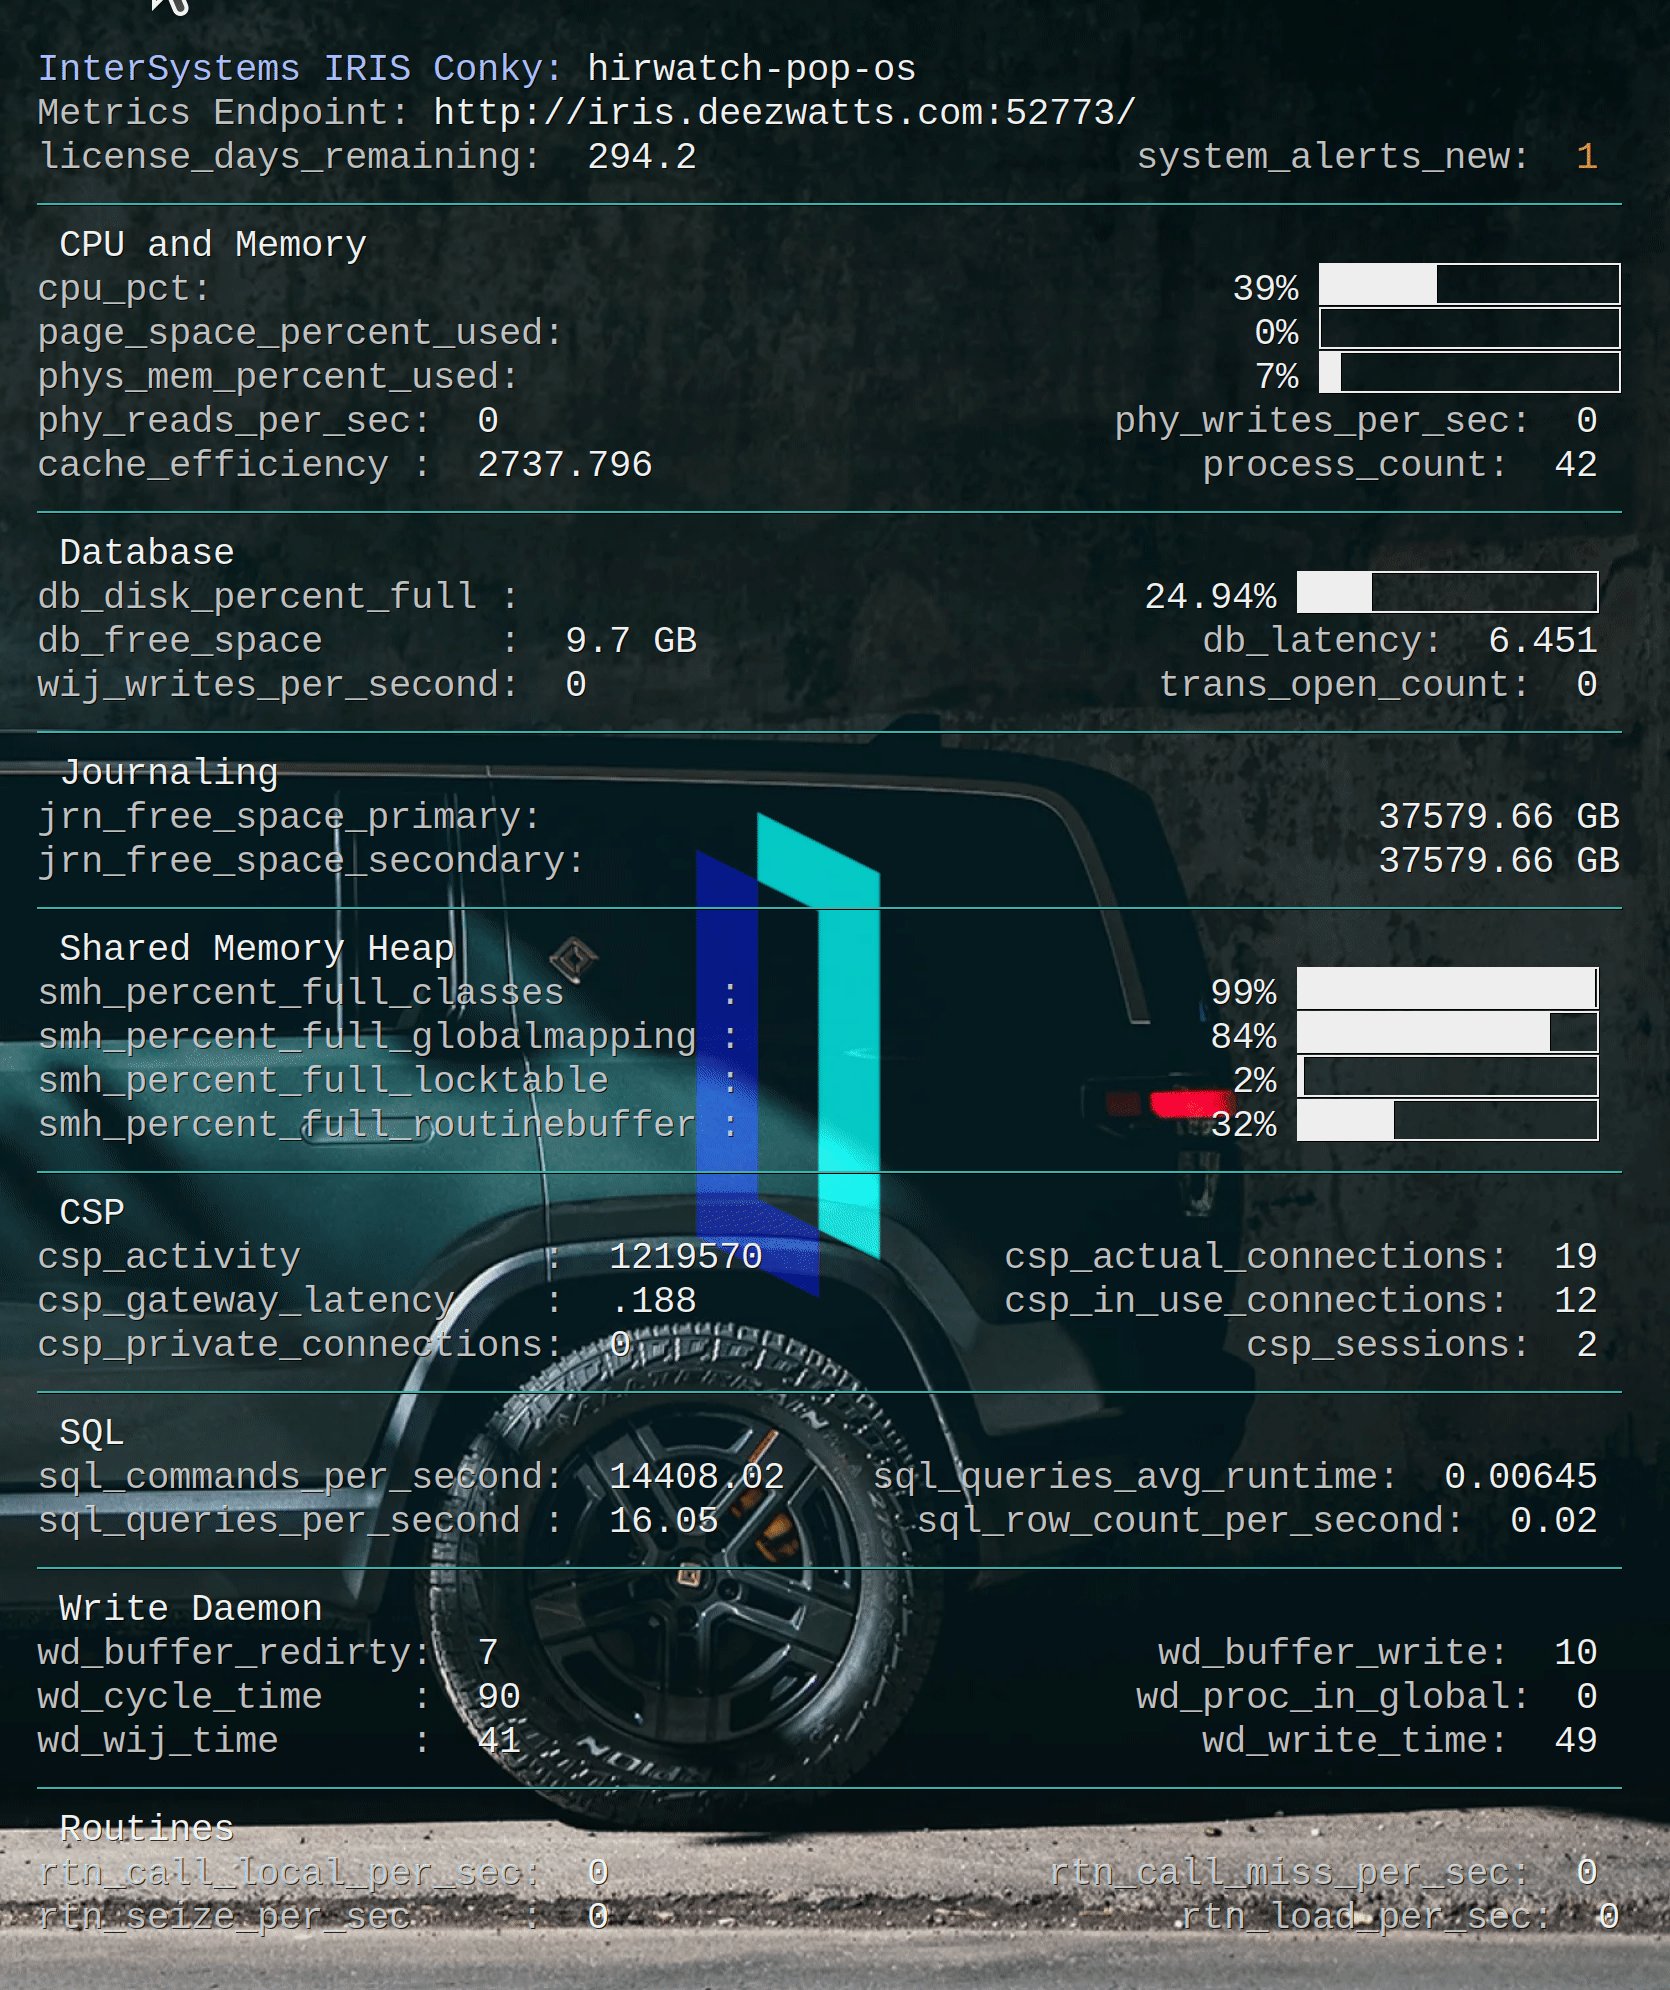
Released with no formal announcement in IRIS preview release 2019.4 is the /api/monitor service exposing IRIS metrics in Prometheus format. Big news for anyone wanting to use IRIS metrics as part of their monitoring and alerting solution. The API is a component of the new IRIS System Alerting and Monitoring (SAM) solution that will be released in an upcoming version of IRIS.

11 2
7 1.8K

From time to time, we get the previous question in support, something or someone is using more licenses than expected, and we need to find what.

We have two scenarios. The first scenario is when we realize that the licenses are exhausted when the application does not work or when we try to connect through the terminal and get the "lovely"

<LICENSE LIMIT EXCEEDED> message:

7 1
0 578

In this post I would like to talk about the syslog table. I will cover what it is, how you look at it, what the entries really are, and why it may be important to you. The syslog table can contain important diagnostic information. If your system is having any problems, it is important to understand how to look at this table and what information is contained there.

15 1
1 2.4K
Article
· Feb 7, 2023 3m read
IRIS Queue monitoring component

1. Overview

With more and more hospital applications built, business interface data processing may be affected by a variety of factors (network, consumer systems, etc.), there is an excessive accumulation of messages or even cause interface lag, affecting the routine performance of hospital IT systems , so the monitoring of the business interface components queue is increasingly important.

While current Intersystems IRIS platform's built-in queue monitoring only displays real-time queue information for interface components, which is limited in providing the queue data information needed by hospitals. The queue monitoring component program is based on the Intersystems IRIS platform and can monitor all interface components and display component queue information within 24h of the component, as well as query component historical queue data by setting a time period to better meet the needs of current in-hospital applications.

4 1
0 227

Hi Community,

This article assumes that you are familiar with Zabbix and SNMP monitoring, if not, there are some very interesting posts on the Community, especially this one (https://community.intersystems.com/post/creating-custom-snmp-oids) which contains a lot of information on how to configure and request an SNMP Cache server.

6 0
0 6.7K

Hi All,

With this article, I would like to show you how easily and dynamically System Alerting and Monitoring (or SAM for short) can be configured. The use case could be that of a fast and agile CI/CD provisioning pipeline where you want to run your unit-tests but also stress-tests and you would want to quickly be able to see if those tests are successful or how they are stressing the systems and your application (the InterSystems IRIS backend SAM API is extendable for your APM implementation).

4 0
1 645

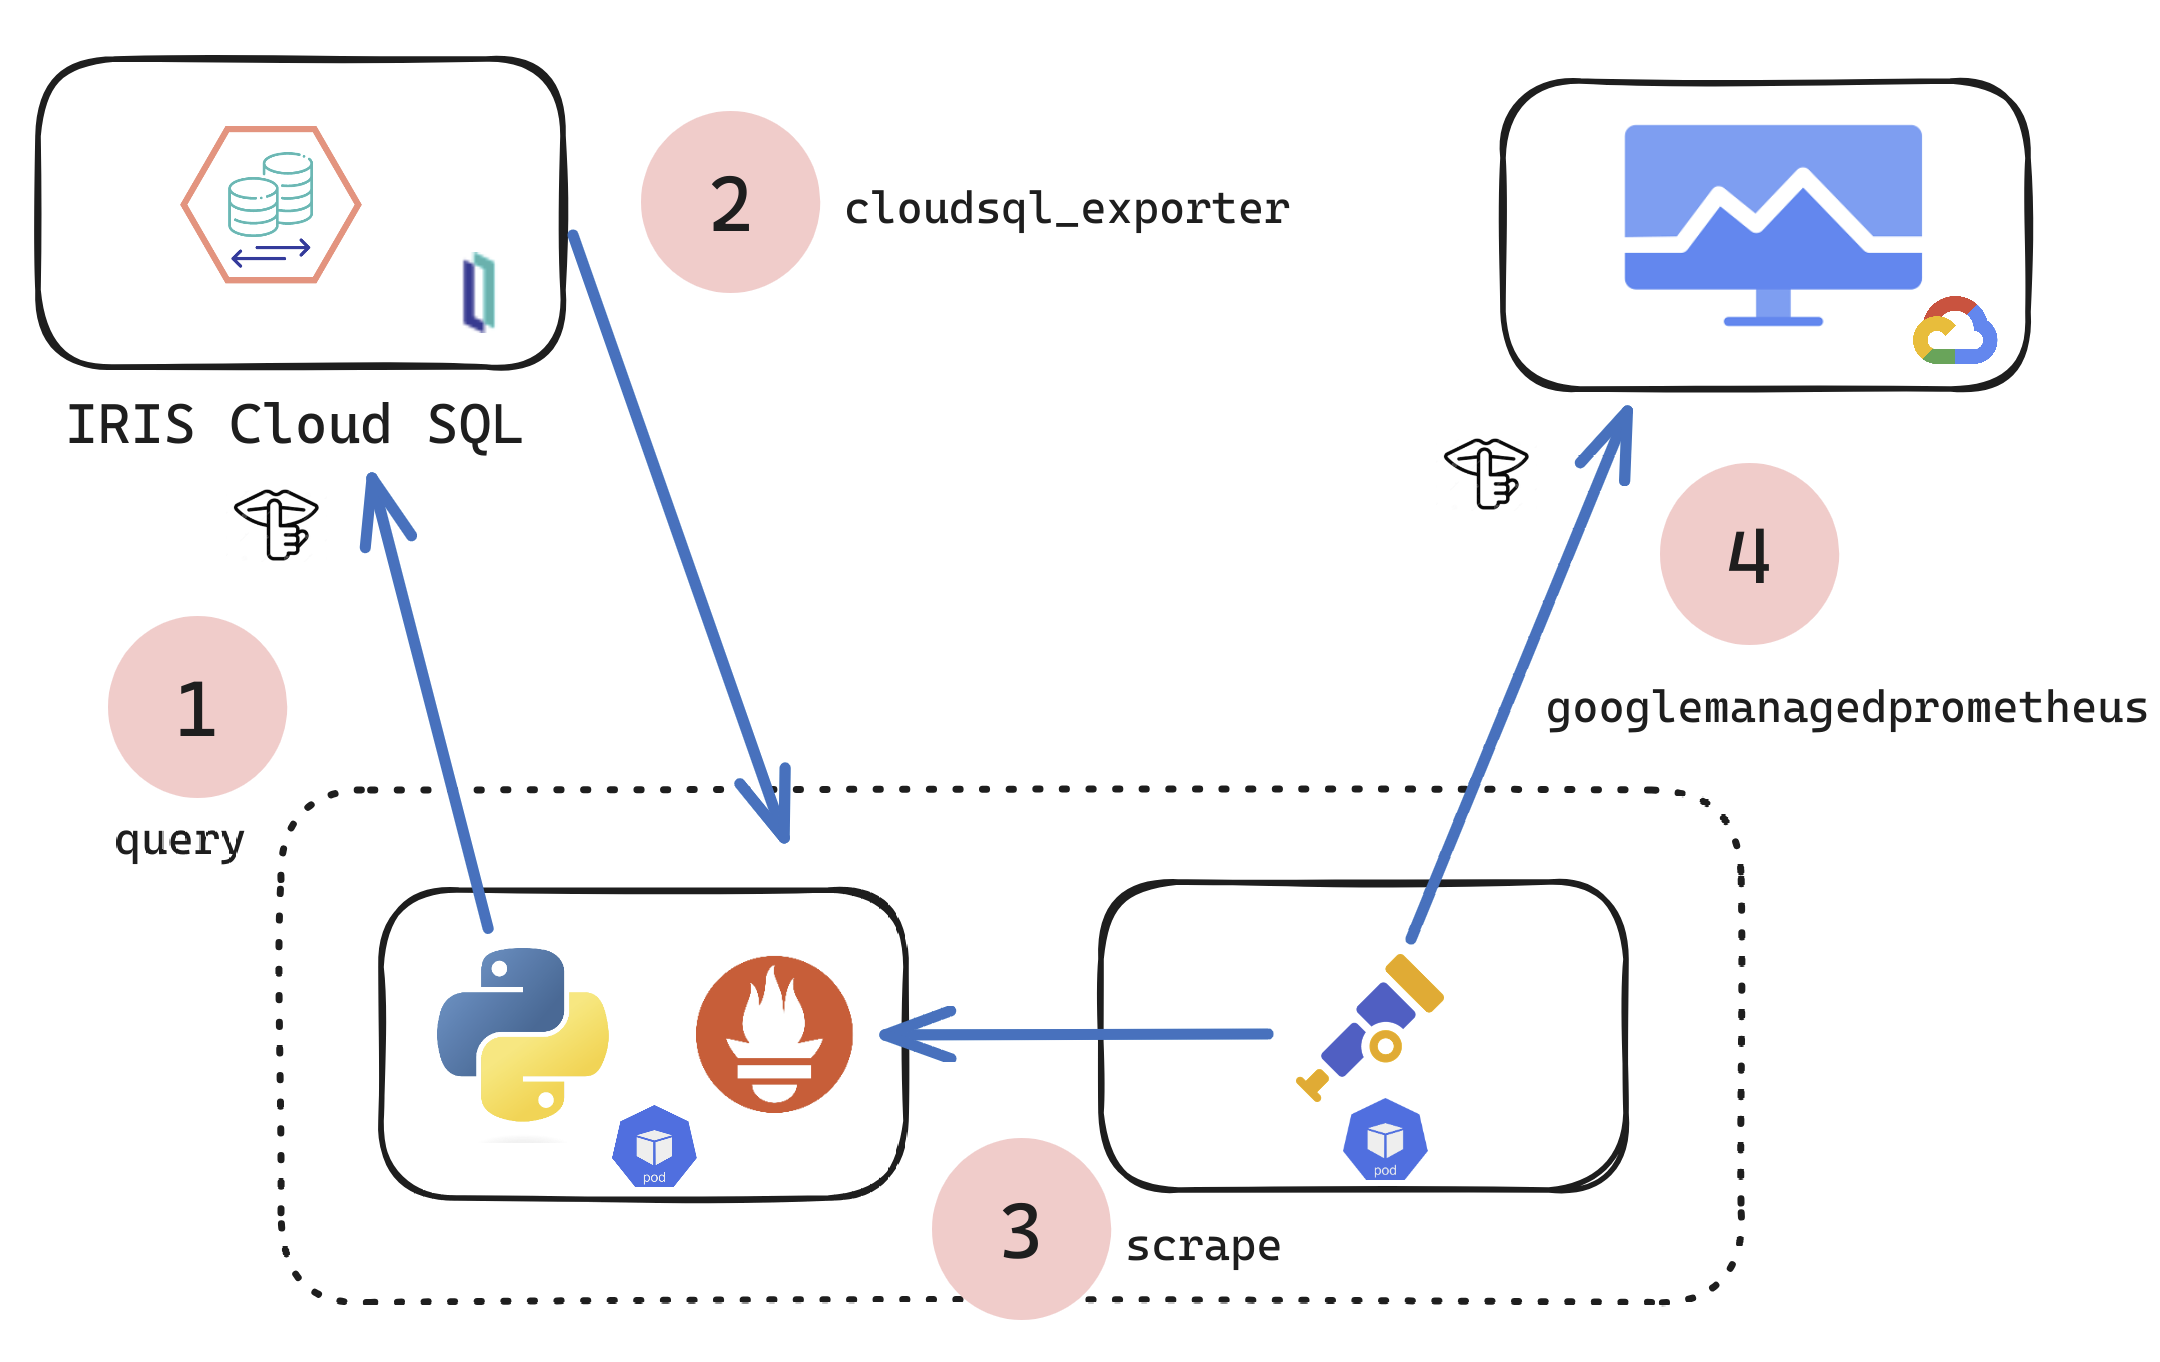
If you are a customer of the new InterSystems IRIS® Cloud SQL and InterSystems IRIS® Cloud IntegratedML® cloud offerings and want access to the metrics of your deployments and send them to your own Observability platform, here is a quick and dirty way to get it done by sending the metrics to Google Cloud Platform Monitoring (formerly StackDriver).

11 0
2 117

Presenter: Kerry Kirkham
Task: Prevent application-to-application interface problems from escalating
Approach: Give examples of using alerts to get the right person working on a problem as soon as possible

Problems with application-to-application interfaces are inevitable but in most cases they can be fixed with little disruption as long as the right person gets to know about it as soon as possible. But delays in attention cause problems to escalate, pressure mounts and business suffers. This session looks at how monitoring and alerting can be set up to recognize problems and get the right person working on the problem in the shortest possible time so that small problems don’t turn into major issues.

Solution: Using alerts to minimize interface problems

Content related to this session, including slides, video and additional learning content can be found here.

0 0
0 297

Presenter: Luca Ravazzolo
Task: Track the status and performance of clustered environments
Approach: Give examples of using modern technology to spot potential bottlenecks before they turn into problems

This session will discuss how modern technology can be used to keep track of the status and performance of your cloud clustered environments.

Content related to this session, including slides, video and additional learning content can be found here.

0 0
0 278

Presenter: Barry Cooper
Task: Enable users to perform analytics within an application and take actions based on those analytics
Approach: Provide examples of embedding DeepSee within applications

Analytics is more than just using data to provide insight. Analytics is about taking action on that insight. See examples of how you can embed DeepSee in your applications, allowing you to take action.

Content related to this session, including slides, video and additional learning content can be found here.

0 0
0 160

Welcome to the next chapter of my CI/CD series, where we discuss possible approaches toward software development with InterSystems technologies and GitLab.
Today, we continue talking about Interoperability, specifically monitoring your Interoperability deployments. If you haven't yet, set up Alerting for all your Interoperability productions to get alerts about errors and production state in general.

Inactivity Timeout is a setting common to all Interoperability Business Hosts. A business host has an Inactive status after it has not received any messages within the number of seconds specified by the Inactivity Timeout field. The production Monitor Service periodically reviews the status of business services and business operations within the production and marks the item as Inactive if it has not done anything within the Inactivity Timeout period.
The default value is 0 (zero). If this setting is 0, the business host will never be marked Inactive, no matter how long it stands idle.

This is an extremely useful setting since it generates alerts, which, together with configured alerting, allows for real-time notifications about production issues. Business Host being idle means there might be some issues with production, integrations, or network connectivity worth looking into.
However, Business Host can have only one constant Inactivity Timeout setting, which might generate unnecessary alerts during known periods of low traffic: nights, weekends, holidays, etc.
In this article, I will outline several approaches towards dynamic Inactivity Timeout implementation. While I do provide a working example (currently running in production for one of our customers), this article is more of a guideline for building your own dynamic Inactivity Timeout implementation, so don't consider the proposed solution as the only alternative.

5 0
0 1K