InterSystems Business Intelligence enables you to embed business intelligence (BI) into your applications so that your users can ask and answer sophisticated questions of their data. Specifically, your application can include dashboards, which can include the following:
Interactive widgets that execute queries designed for specific user roles or for specific areas of your user interface.
Controls such as drop-down lists and data choosers that enable users to modify these queries.
Interactive drill options that enable users to view the displayed data in different ways.
Options to export, print, and send alerts to other users.
An option to launch the Mini Analyzer, which supports free-form analysis.
Execute custom actions that are provided as buttons or other controls.
In contrast to traditional BI systems that use static data warehouses, Business Intelligence is kept closely in synchronization with the live transactional data, as required for your business.
I need to pass multiple values to a FILTER to a DeepSee DASHBOARD via the URL. The documentation seems to indicate this can be done, i.e.: "Where each filterspec is filter_name.filter_values" but there are no examples I can find that indicates what is used to separate multiple values. Say I want to pass the three values 5, 6, and 1395 to a filter. To pass just the 5 I know this works:
&SETTINGS=FILTER:LEAD.MYUSERID.H1.MYUSERID.5
but how do I include 6 and 1395. None of the following seem to work:
When creating pivots in DeepSee, there is the ability to group date dimensions by Day, Week, Month, Quarter, Year. For some of our reporting the Week option is desired. However the display looks like the image shown below. Notice the "YYYYW##" formatting.
Is there any ability within DeepSee to modify the display of grouped week dates? E.g. instead of 2020W14 it could be 03/30/2020-04/05-2020, or even just the start or end date, etc.
When you have been using cubes for business intelligence in a namespace for some time, you may find that there are many cubes in the namespace, only some of which are actively being used. However, it can be difficult to tell which cubes users are or are not querying, and maintaining unused cubes can be costly both in terms of storage and of computation to keep them up to date. This article provides some suggestions and examples for monitoring which cubes are in active use, and for removing cubes that you determine are no longer necessary.
In looking at the Production monitor within Ensemble, I was wondering if there is a way we could customize it for our use. I notice it is basically a dashboard.
For example I would only like to truly display those Services, Processes, and Operations that are truly in dire need of attention. The Monitor out of the box just seems too busy, and I would like to simplify it.
I am still trying to figure that Calculated Measure stuff and I hope to learn from you. I have several cubes I am trying to create calculated measures using the Calculated Member Expression.
I have a cube called Cards. There is a measure called count that give total cards count of 15,000. There are two dimensions I am considering. One is the CreditGrade (A, B, C, D, nograde) and the other is the date of the scoredate.(2000-2015).
The CreditGrade dimension has two hierarchies. H1 being the creditnumber and H2 being the CreditGrade (The one I need).
With the gradual improvement of hospital information construction, there are more and more business interfaces in hospitals. Due to the influence of various factors (network, consumer system, etc.), the data processing of business interface may cause excessive message accumulation and even the situation of interface card congestion, which affects the normal business development in the hospital. Therefore, the monitoring of the queue of business interface components becomes more and more important.
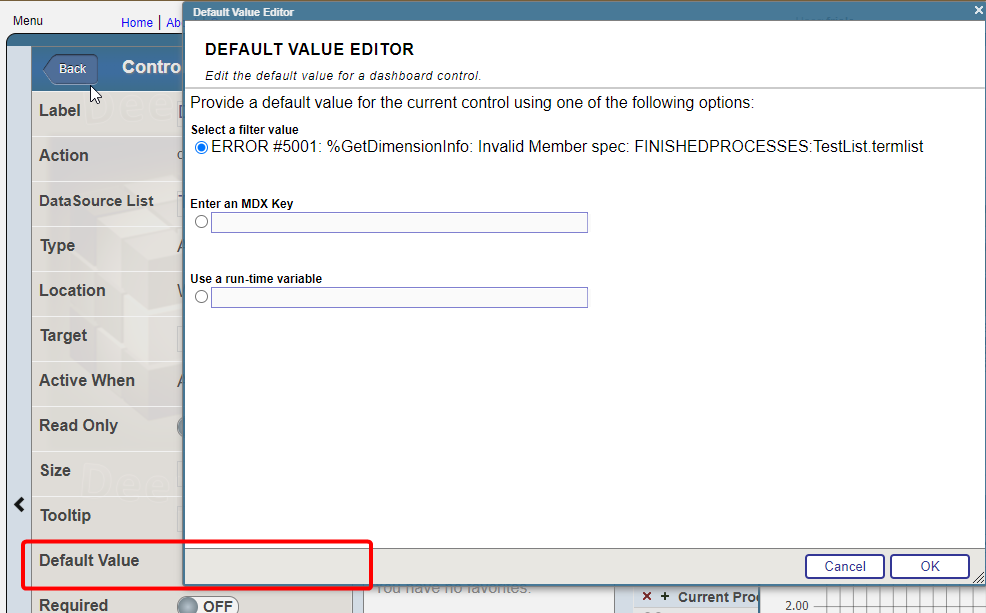
I have a widget that uses "choose Data source" control option. Termlist for the control consist of the two data sources and i want to set one of them by default. For example: I have two data sources, one is grouped by month, the other by year. I need to set the one that is grouped by year by default
Is it possible to lock down health insight so a client can only query their own patients? and
Is there a way to use a visualization tool like Tableau instead of the dashboard of DeepSee while still querying from DeepSee?
The situation is, I have a Partner that is looking to create common Dashboards in a SaaS model where the Partner's Clients would want to have their individual views of this common dashbaord be branded (logos, color, styles, etc.) to match the Client's branding. This my Partner's Client's End Users will see this common dashboard as the dashboard from the "Client" and not the "Partner" (and certainly not ISC branding)
I'm trying to calculate the percentage of the top level with the SUM function. But I don't understand the PARENT behavior. It does not work in any way!
I would like to know if DeepSee has some feature regarding synchronization which could help me with this:
I have two tables, TableA and TableB in a 1:n relationship, and one cube for each table, CubeA and CubeB. CubeA have a list dimension based on records from TableB. Both tables has DSTIME parameter set to "AUTO".
Some application proccess updates data only on TableB, leading an entry on ^OBJ.DSTIME global for synchronization of CubeB. However, as the TableA wasn't updated, there isn't such entry for CubeA.
I'm looking for a means to dynamically specify and/or limit the data from the source that goes into a cube at build time.
I have a single data class that defines my source, and as the data within this table/collection grows/changes over time, I would like to be able to control which records actually make it into the indexed cube, but I'm having a hard time (short of defining a stored procedure to use instead of the extent query) for populating my cube indexes.
Sometimes you when create a pivot in Analyzer and see the result that shouldn't exist - don't run to create a WRC ticket, try to call the IRIS BI reset function first:
Class DSW.Addons.htmlViewer Extends %DeepSee.Component.Portlet.abstractPortlet
{

Property Data As %String;

ClassMethod %OnGetPortletSettings(Output pInfo As %List, ByRef pSettings) As %Status
{
    Kill pInfo
    Set pInfo(1) = $lb("Data", , , "Data", "Data setting")
    Quit $$$OK
}
}
It's a ZEN component and DeepSee portlet. It's immediately available in the namespace I created it in. DSW package is mapped to %ALL and to Samples, but if I try to create a widget with this portlet I get ZEN class not found error.
Aside from doing a print to PDF is there any way to use the existing DeepSee "export to PDF" functionality to export the entire dashboard rather than each individual pivot or chart?
I have a DeepSee KPI defined based on %DeepSee.KPI following the documentation http://docs.intersystems.com/latest/csp/docbook/DocBook.UI.Page.cls?KEY=.... I've then enabled the KPI on a dashboard by adding a Widget where the data source is the KPI. Currently the ability to show a Detail Listing is implemented by the call back %OnGetListingSQL. This method documents the parameter
-- We have our Pivot ready for some data for all accounts. And we want to now filter it by Account
[Account].[H1].Account.&[1]
It works fine at the pivot level and it filters the records. We save the pivot with no filter values as we want users to decide the Account they want to filter for
-Now If i save this pivot without a value of a filter , then obviously it has all records and I want to filter it at the Dashboard level on my page.
 By replies
.png)
 Open Exchange app