InterSystems Business Intelligence enables you to embed business intelligence (BI) into your applications so that your users can ask and answer sophisticated questions of their data. Specifically, your application can include dashboards, which can include the following:
Interactive widgets that execute queries designed for specific user roles or for specific areas of your user interface.
Controls such as drop-down lists and data choosers that enable users to modify these queries.
Interactive drill options that enable users to view the displayed data in different ways.
Options to export, print, and send alerts to other users.
An option to launch the Mini Analyzer, which supports free-form analysis.
Execute custom actions that are provided as buttons or other controls.
In contrast to traditional BI systems that use static data warehouses, Business Intelligence is kept closely in synchronization with the live transactional data, as required for your business.
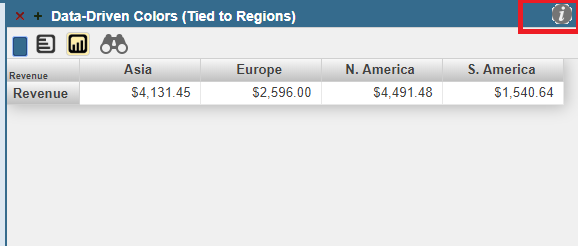
I want to include Info icon on DeepSee-Widget title bar like the image below. And when I click or hover on the icon it should display some information about the widget. I tried with the options available in Widget settings and referred InterSystems's documention as well, I couldn't find a way to get this.
Please help me to achieve this. Thanks in advance.
According to the documentation (2016.1) we can use either a system defined web application (/api/deepsee) or create a custom web application for handling requests. What are some reasons to use one rather than the other?
I am trying to figure out how to compare two dimension values in a MDX query such that records where two dimension values are the same will be filtered out.
To test this, I have modified the HoleFoods cube in SAMPLES namespace to have a new dimension called RandomRegion
I want to create a MDX query where the [Outlet].[H1].[Region] value is not equal to the [RandomRegion].[H1].[RandomRegion] value.
I need an example of what I need to "map" to have a common dashboard defined so it will visible/usable in multiple namespaces.
I have created a dashboard in "SAMPLES" (namespace and database) and I would like to have this dashboard be accessable/useable from a 2nd namespace, but I'm not having any success in doing mappings (global/package/routine/data) to be able to get DeepSee to be able to see/display the dashboard.
I need to create a KPI similar to the DeepSee.Model.KPIs.DemoTrendLines kpi in Samples. This kpi supports a scorecard widget with a trend line. It shows patient counts by city with a trend line of the count of patients over a decade. What I want is to show the trend line based on the average allergy score ([Measures].[Avg Test Score]). A pivot table query that shows the data I would want to base the trend line on is:
Hello, I've completed this tutorial: https://community.intersystems.com/post/deepsee-period-date-vs-same-peri... I've used the "year" level instead of a pivot variable. I want to calculate something like the following variation: 100 * ([DateOfSale].[PTD] - [DateOfSale].[LYPTD]) / [DateOfSale].[LYPTD] I create a new calculated member, under the same dimmension with the above expression.
When you deploy DeepSee solutions you often do not want grant a User %All Role to work with a particular Dashboard.
Consider a Dashboard 'Dash' with a few widgets where listings are being used.
If you manage a Role to get access to the Dash you need to grant access to %DB_DBNAME resource to have a database access, grant access to a Dashboard resource (if any) and ... grant SELECT accesses to all the tables involved in SQL queries being used in all the listings of widgets.
Hi everyone! My company has a Zen ERP application with CSP delegated authentication. Now, we're developing a separated BI application, using Angular, which consumes DeepSee REST API services. Both applications access the same Caché database.
How to implement single sign-on strategy in order to allow an already authenticated ERP user to access DeepSee REST services? Has anyone already implemented something like that?
Hi, I cannot edit properties (title etc) of Widgets within Dashboards outside of the ENSDEMO namespace: I have a namespace "HL7Report" for example; I have some Pivots created looking into a cube's data; I click "DeepSee", "User Portal" from the Management Portal; I click "+", "Add Dashboard", folder/name/title/category all as "new", "OK", new dashboard appears; I click ">", "Widgets >", "+", and select a pivot to display as a table (chart / anything);
I would like to pass multiple values of a FILTER from one DeepSee DASHBOARD to another DeepSee DASHBOARD. The documentation indicate this can be done via an URL. Are there any examples this type of configuration?
I am looking for a reporting tool (Analytics purpose) which can be built using cache object script/MUMPS. Basically my requirement is to find a tool where I can implement cache code to report data for my application.
I am unaware of DeepSee and how it works. Please assist for the same.
How can I create a calculated field to give the previous date. For example, I need to create a pivot table that shows total payments posted for the prior day.
How to create a calculated field to show average daily collections divided by the number of the days passed in a month. So, for today, it would be the average daily collections divided by 4days.
My testers are getting this Internal Server Error inconsistently. There is no specific steps to reproduce this error. Can you any one explain when will we get this error in DeepSee.
In addition to charts on a dashboard we have a request to have a crosstab which would be populated by some entries queried out of an error log. It's basically a detail query with mostly text data. I have tried making a pivot widget for this using both a cube and kpi source, and while succeeding with the KPI, it leaves a lot to be desired.
When I export the cube and the pivots that I made and import to another environment , the calculated metrics and dimension and also de pivot variable didn´t appear in the other environment. Because of this the pivot that use these metrics show error when you try to open.
I want to know that this behavior is normal or exist a way that you can export everything, independent if you build inside the cube or inside analyzer.
The question that I have , it's very simple. I developed a pivot that contains two rows, the first it's a date and the other another field. I need to orde by date in descending order and I can´t find where I can do this. I saw that it's a option Sort members, but it's based in a condition of the measures.
I have created user with access to a profile with all the %Deep_See options (%DeepSee_Admin, %DeepSee_Analyzer etc etc) as well as %All. I have also added %All to unknownuser
When click the DeepSee page and choose a namespace Architect, Analyzer, Reporting Data Definition and Reporting Builder are all greyed out with 'you do not have privilege to view this page
I know per documentation (pasted below) to set the DSTIME parameters for the base class of a cube. If that base class has a property that is another class, do I have to add the DSTIME parameters to that secondary class?
Documentation says the following in a section titled "Enabling Cube Synchronization:"
Before you can synchronize a cube, you must enable the cube synchronization feature for that cube. To do so:
 By replies