The source class of a DeepSee cube has a property referencing a different class:

Class ClassA Extends %Persistent {
     Property P1 As ClassB;
}

When records in class B change, the ^OBJ.DSTIME global for Class A will not be automatically updated. This means that synchronization of cubes based on source class A will not reflect the changes occurred to property P1.
This post will help you determine the best way to achieve synchronization of properties referencing a different class

4 2
2 511

Hi guys.

Recently, I get interest in FHIR in order to run for the IRIS for Health FHIR
contest
. As a beginner on this topic, I've heard somewhat about it, but I didn't know how complex and powerful was FHIR. As pointed out by @Henrique.GonçalvesDias here, you can model several aspects of the patient history and other related entities.

4 5
0 352
Article
· Feb 3, 2023 3m read
Queue monitoring

Overview

With the gradual improvement of hospital information construction, there are more and more business interfaces in hospitals. Due to the influence of various factors (network, consumer system, etc.), the data processing of business interface may cause excessive message accumulation and even the situation of interface card congestion, which affects the normal business development in the hospital. Therefore, the monitoring of the queue of business interface components becomes more and more important.

3 2
0 494
Article
· Aug 13, 2021 4m read
Building Analytics Solution with IRIS

Hi developers!

How to build an analytics solution with InterSystems IRIS?

To begin with, let's agree on the points of what is the analytics solution - and this could be a very wide topic. Let's limit the set of solutions to those you can present in the Analytics contest.

There are three kinds of analytics solutions that we will review here: monitoring, interactive analytics, and reporting.

Monitoring

The typical monitoring solution consists of an online dashboard with KPIs that are being actively updated.

The key use case is of monitoring is to visually observe the KPI of fresh data every moment to react in case of an emergency.

Interactive Analytics

This solution supposes a set of interactive dashboards with filters and drill-downs.

The key use case is to explore the data with filters and drill-downs making business decisions upon graph and table data visualization.

Reporting

Reporting solution provides a set of static (usually) reports in a form of HTML or pdf documents that deliver the data in graph and text form in a predesigned form and could be sent via email.

The typical use case of a reporting system is to obtain reports on a given period that will illustrate the status of the product, process, service, sales, etc that is crucial for the business.

How InterSystems products could be used to build such solutions? Let's discuss this below!

3 0
1 460

When we are at the starting stage of BI project development, we must remember that it is crucial to select the right tool for its implementation. Today we want to show you how one of the principal functionality of dashboards is implemented in different BI systems. Let's talk about drill down from both points of view: the dashboard development, and the convenience and clarity for the end user. We will touch on the applications of this technology in IRIS BI, Power BI and Tableau.

3 1
0 810

When using Related Cubes in InterSystems IRIS BI, cubes must be built in the proper order. The One side must be built before the Many side. This is because during build time for the Many side, it looks up the record on the One side and creates a link. If the referenced record is not found on the One side, a Missing Relationship build error is generated. The One side is going to be the independent side of the relationship, AKA the side of the relationship that is referenced by the Many side or the Dependent cube. For example: Patients contain a reference to their Doctor.

3 0
0 548

Previously I have already tried to play with Google Data Studio when I connected it to InterSystems FHIRaaS. It has quite a nice UI, with a few chart types available out of the box, it can be quite easily connected to some plain tables (stored as CSV or JSON, for instance), and gives the ability to build quite flexible analytics over it. So, I have decided to implement a new connector to InterSystems Analytics (DeepSee), with the ability to select a cube and do some queries on it.

3 0
0 361
Article
· May 28, 2016 3m read
DeepSee Listing Groups

This article is about DeepSee Listing Groups, a new DeepSee feature that was introduced in release 2015.2.

DeepSee Listings have always been a part of DeepSee. DeepSee Listing Groups provide increased flexibility by allowing you to create new DeepSee Listings without modifying the cube definition.

3 3
0 316

There are several options how to deliver user interface(UI) for DeepSee BI solutions. The most common approaches are:

  • use native DeepSee Dashboards, get web UI in Zen and deliver it in your web apps.
  • use DeepSee REST API, get and build your own UI widgets and dashboards.

The 1st approach is good because of the possibility to build BI dashboards without coding relatively fast, but you are limited with preset widgets library which is expandable but with a lot of development efforts.

The 2nd provides you the way to use any comprehensive js framework (D3, Highcharts, etc) to visualize your DeepSee data, but you need to code widgets and dashboards on your own.

Today I want to tell you about yet another approach which combines both listed above and provides Angular based web UI for DeepSee Dashboards - DeepSee Web library.

3 16
5 2.4K
Article
· Aug 2, 2020 1m read
Application Errors Analytics

Hi Developers!

As you know the application errors live in ^ERRORS global. They appear there if you call:

d e.Log() 

in a Catch section of Try-Catch.

With @Robert.Cemper1003's approach, you can now use SQL to examine it.

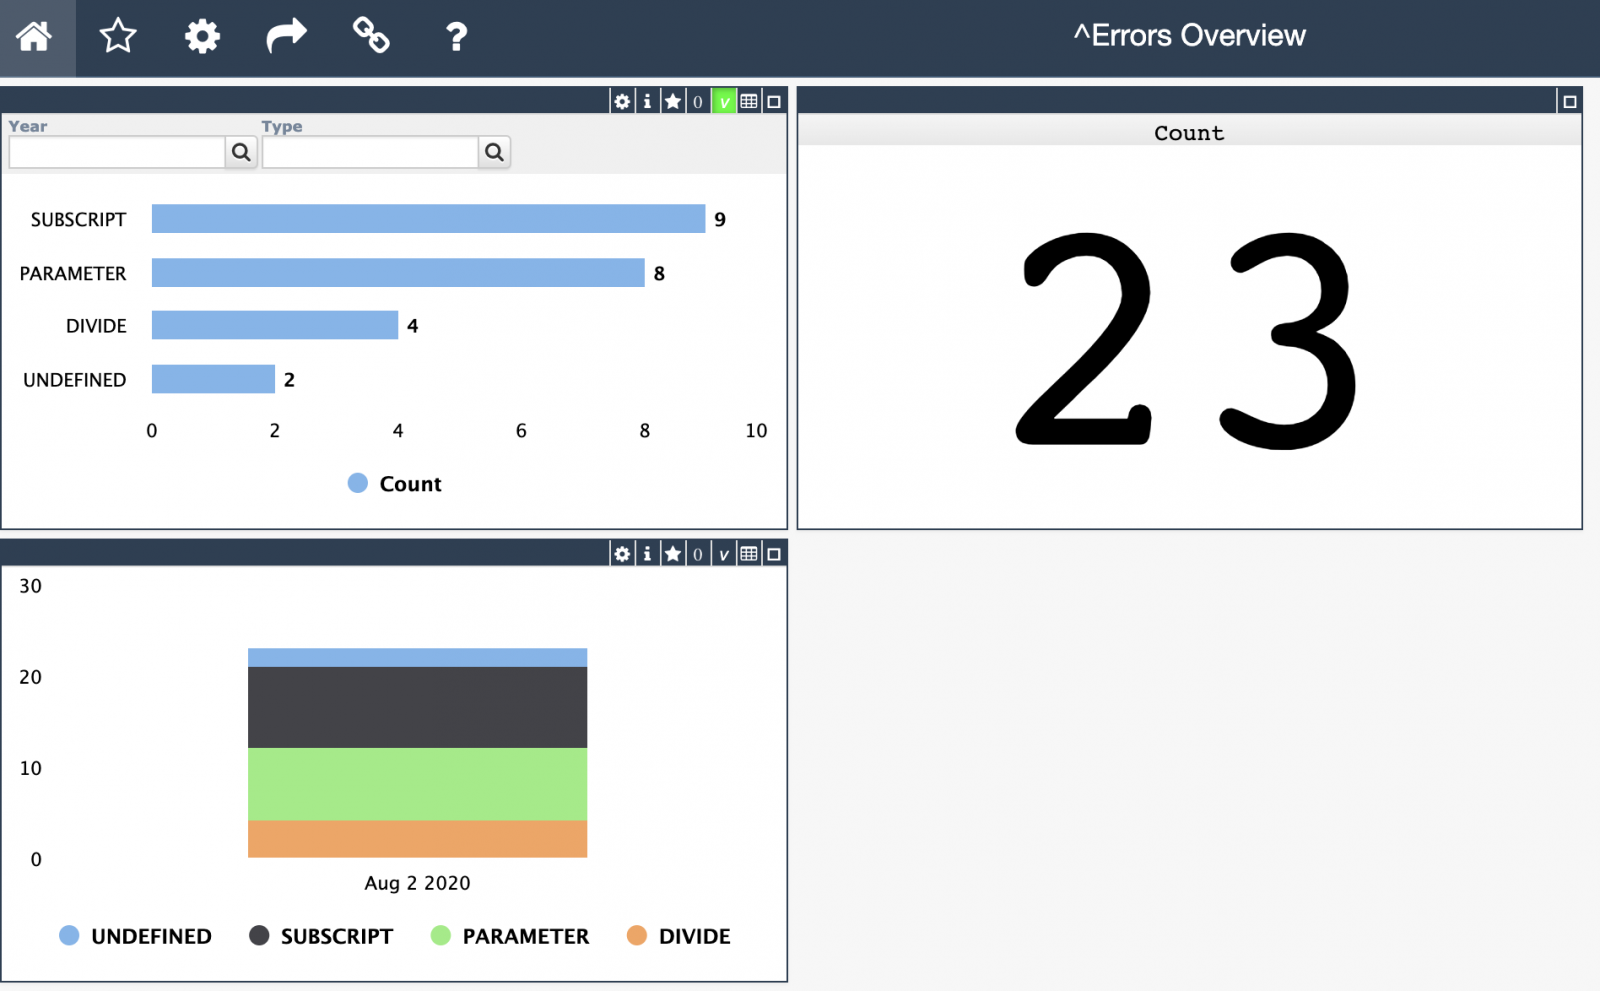
Inspired by Robert's module I introduced a simple IRIS Analytics module which shows these errors in a dashboard:

3 5
1 363

Introduction

Any election is a highly mysterious process, and when you look at its results, the overall picture is not quite clear. I decided to put them, region by region, on the map of Moscow using InterSystems technologies that offer both storage and data analysis functionality. In this particular case, I used InterSystems Ensemble, a platform for application development and integration, but you can also build this solution using the multi-model InterSystems Caché DBMS, as well as InterSystems’ new product called IRIS Data Platform.

3 0
0 775

Hi guys!

I'd like to present you my new project: iris-analytics-notebook, a notebook approach to use IRIS analytics capabilities.

Project description

In past few years, notebooks tools like Jupyter are gaining popularity due its natural way to express ideias.

An almost unipresent tool for data scientists, notebook can also help to improve the impact of analytics tools for all sort of users.

2 0
0 249
Article
· Dec 31, 2019 3m read
Portlets that use data from DeepSee


In the previous part of this series, we saw how to reference a web page that will enhance our dashboard experience. Now we will look into referencing data that is already in our cubes.

In this example, we will be referencing the controller object and we will be extracting data from it. This data will then be displayed as text in our Dashboard. In Part 5, we will show how to incorporate this data into other charting libraries.

2 0
0 266
Article
· Sep 9, 2022 1m read
DC Analytics Open Application

InterSystems Developer Community analytics. Project made with InterSystems IRIS BI (DeepSee), Power BI and Logi Report Designer to visualize and analyze members, articles, questions, answers, views and other pieces of content and activity on InterSystems Developer Community.

You can see your own activity, articles and questions. Track how your contribution changes developer community.

2 0
0 300