Hey Developers,
In this video, you will learn how to use VS Code with Python:
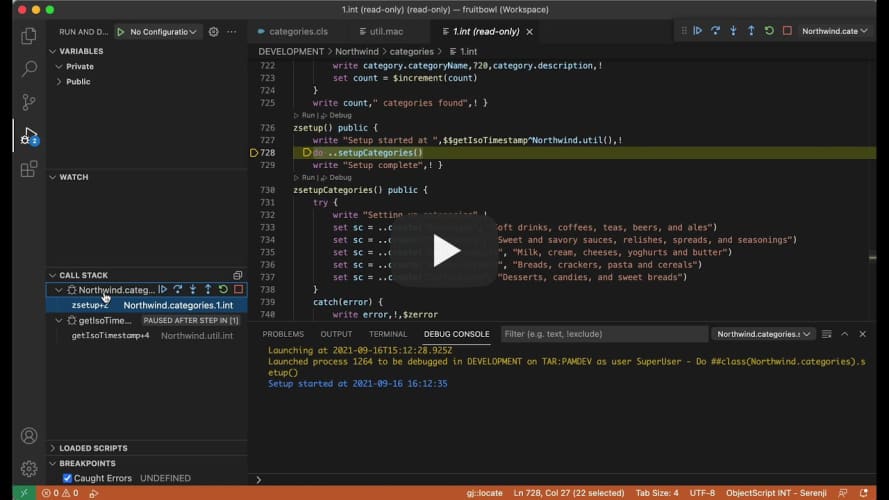
Debugging is the process of finding and resolving defects or problems within a computer program that prevents the correct operation of computer software or a system.
Hey Developers,
In this video, you will learn how to use VS Code with Python:
Hey Developers,
New video is already on InterSystems Developers YouTube channel:
How can I do to debug IRIS docker instance into VSCode?
I would like to watch a webseminar about debug objectscript techniques into vscode to rest api, productions and embedded python, specially using docker instances and remote servers.
InterSystems technologies are renowned for their high performing databases, which support the systems and operations of many organisations. However a key ingredient to this success is the quality and maintainability of their code.
The quality of code can impact everything from speed and ease of fixing bugs and making enhancements, to the overall performance of your organization and your ability to get ahead in the marketplace.
By ensuring your code is maintainable, you can reduce approximately 75% of the systems life cycle costs*. This is why, at George James Software, the solutions we build are always straightforward and written in high quality code - because we know that this solid foundation can positively impact the rest of your organization.
With a maintainable system you're able to reduce your overall maintenance as any issues that occur are significantly faster to identify and fix. This means you're free to allocate that time and budget to enhancements, enabling you to get the most value out of your applications and ultimately better support your organization.
Keep an eye out for our next few posts about what a maintainable system looks like and the tools that can help you keep your code maintainable, in order to help you to reduce those maintenance costs.
Ladies and gentlemen!
Is there a way (some secret call? ) to turn on a debug mode for a particular IRIS web app?
The reason is to log debug information in REST-API dispatch methods if the app is in debug mode.
Of course, I could use "a global", but if there is any standard way?
Hello,
I don't know if the title is accurate enough. I have a legacy code that I need to optimize. It's a routine written in objectscript. It accepts 4 parameters and runs 6 nested FOR...$ORDER reading a big global.
The thing is when I run the routine the first time it takes around 60 seconds to run. If I run it again it takes 5 seconds. If I wait around 6 to 10 minutes to run it again, it takes 60 seconds again, but if I run it every 1, 2, 3... minutes it still takes only 5 seconds to run.
We're hosting our Deltanji and Serenji user group session tomorrow - there's still time to register, if you haven't already.
We'll be showcasing some advanced features of Deltanji and Serenji in VS Code with time for a discussion - so feel free to bring along any problems you need help solving or share your feedback on our tools. We'd love to hear your thoughts. If you're interested in our tools this is a great chance to hear what others have to say, as well as asking your own questions.
Date: Wednesday, November 3rd
Time: 11-12pm EDT / 3-4pm GMT.
Let us know you'll be attending on Eventbrite.
We hope to see you tomorrow, but if you're unable to make it you can email me at laurelj@georgejames.com and I can share a recording of the session.

Hi developers,
We're hosting a User Group session for our Deltanji source control and Serenji debugger users on Wednesday, November 3rd at 11-12pm EDT / 3-4pm GMT.
We'll be showcasing some advanced features of Deltanji and Serenji in VS Code with time for a discussion - so feel free to bring along any problems you need help solving or share your feedback on our tools. We'd love to hear your thoughts.
You can find out more on Eventbrite.
Everyone is welcome. If you're interested in our tools this is a great chance to hear what others have to say, as well as asking your own questions.
We hope to see you on November 3rd!
If I open a terminal and type the following commands, sc is an error:
set validator = "sc = ##class(%Library.Numeric).IsValid(""BLAH"")"
set @validator
write sc
At the end, when I write sc I get:
0 L'BLAH9
             DOCXT010,#e^zIsValid+1^%Library.Numeric.1^1e^^^1
However, if I call the following class method using the arguments "%Library.Numeric" and "BLAH", sc is undefined
 ClassMethod testvalidator(class As %String, value As %String) As %Status
{
set validator = "sc = ##class("_class_").IsValid("""_value_""")"
write validator,!
set @validator
write sc,!
The latest release of Serenji focuses on the debug experience. Not only can you now debug on the spot, no matter where you are or what you're doing, but we've also added some smaller features that will make debugging more straightforward.
Find out more in our release notes here.
Hi developers,
We've incorporated VS Code's support for multiple concurrent debug sessions and consoles into the latest release of Serenji.
So if you're working with processes that relate or are dependent on each other, you can now debug them together. Just launch a second Serenji debug session (F5) whilst the first one is still active.
This short video below shows how it works. We hope you find this feature useful!
Laurel

The most recent release of Serenji features our innovative gj::locate technology. It was a standalone tool we originally created for a Developer Community contest earlier this year, but we've incorporated it into our debugger after some great feedback from developers.
It works by navigating you directly to the source of your server-side errors in just a couple of clicks - enabling you to quickly fix errors without the need to count tedious lines of code.
Hi developers,
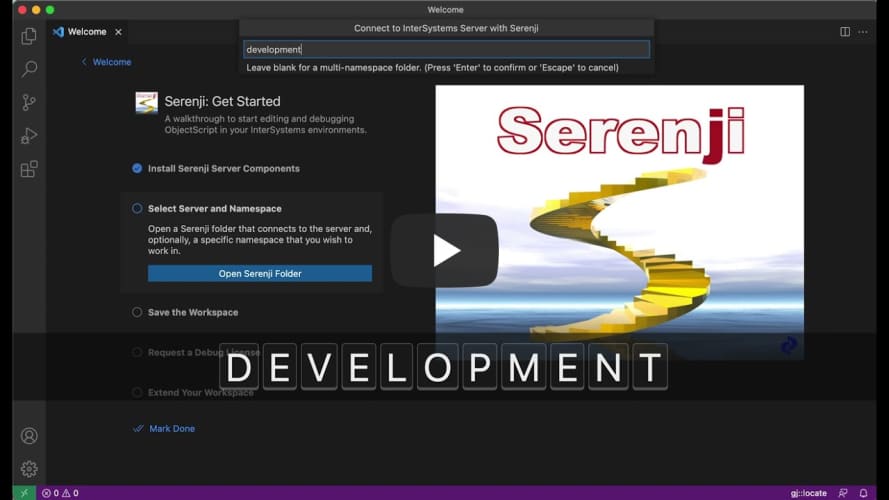
Serenji 3.2.0, the latest version from George James Software, was released last week and our current users have been enjoying trying out the new features (which you can find more about here).
If you're thinking about trying Serenji for the first time, we've made it easier to get set up by adding a walkthrough on the VS Code Welcome page. It takes you through:
We've also added prompts and guidance throughout VS Code to open and add Serenji folders to your workspace and when going to run and debug code.
This is just one of the ways we've enhanced the Serenji debugger to make straightforward and easy to use - so all you need to do is focus on your code.

The latest release of Serenji by George James Software introduces zero configuration debugging, so it's ready to go in just one click - no matter where you are or what you're doing, your on-the-spot debugger is ready to go.
We have introduced a host of new features to enhance the debugging experience so you can focus on identifying and fixing errors, without losing focus by spending time setting up a launch configuration.
Check out the new features in our release notes.
If you've already started using Serenji 3.2.0 let us know how you're getting on!
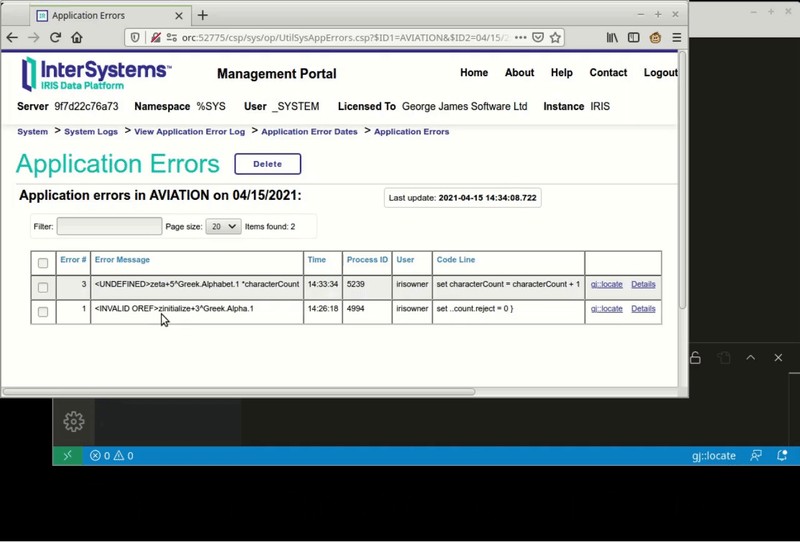
gj :: locate was the entry from George James Software for the Developer Tools competition back in April 2021. When an ObjectScript error is reported, gj :: locate takes the .int line location and navigates you directly to the line in the source file where the error originated. Over the past few months we've found it a very useful tool when it comes to debugging, especially when used alongside the Serenji debugger in Visual Studio Code.
Our first update, version 1.1.0, now includes support for multi-root workspaces. This enables gj :: locate to be used with every workspace folder. If your VS Code workspace has more than one root level folder, connecting to different namespaces or perhaps different servers, then gj :: locate will determine which workspace folder is current and locate the source code in that folder. If your workspace doesn't have any files open then gj :: locate will prompt you to select a folder from a pick-list.
This will particularly benefit VS Code power users who have workspaces with simultaneous connections to multiple namespaces, on multiple different IRIS and Caché servers.
If you would like to try it out then you can download it from the VS Code marketplace. Or if you’re already a user, then gj :: locate will automatically update. Let us know how you're getting on with it!
We’ve published an update to the Serenji debug extension for Visual Studio Code, making it ready for the Workplace Trust feature in VS Code 1.57.
This allows the Serenji ObjectScript editor to work without restrictions across all workspaces and, by bringing it in line with the VS Code update, only allows the debugging feature to be used in trusted workspaces.
Hi,
I'm getting thousands of errors like the ones below:
2021-05-03 14:11:44 [SQLCODE: <-400>:<Ocorreu um erro fatal>] [Cache Error: <<READ>Dispatch+14^%SYS.BINDSRV>] [Location: <ServerLoop>] [Client info: <Username: KIORAS, Node Name: 3IK0VLS5UU, IP Address: 192.168.1.223, Executable Name: EXTRService.exe, Internal Function: B0>] [%protocol: <52>] $Id: //ce/2018.1.2/kernel/common/src/aclass.c#1 $ 23468 104
2021-05-03 14:35:39 [SQLCODE: <-400>:<Ocorreu um erro fatal>] [Cache Error: <<READ>ServerLoop+16^%SYS.
Announcing gj :: locate. A simple extension for VS Code that will help you get to the source of your errors.
In VS Code, using either the Serenji extension or the basic InterSystems objectscript extension, this small add-on will open the appropriate class or routine and position you at the exact line where an error occurred.
No more tedious counting of lines to find <UNDEFINED>zCredit+206^Ledger.Invoice.1. Instead, with gj :: locate you can get there with just a couple of clicks.
This 20 second video tells it all:

Download now and enjoy getting to the source of your errors.
You may think it isn’t too difficult to get from label+offset^routine to the actual source line responsible for the error. For an expert it isn't that hard... most of the time. But there are enough oddities and special rules that even an expert can get it wrong, whilst spending a lot of time trying to get there.
gj :: locate is the latest tool from George James Software – it debugs any error, class or routine by converting the location of an error in compiled .int code to the corresponding location in your source, and then taking you right there.
Image this scenario…
Hi folks!
Often while debugging you want to know the values of all the parameters.
Using VSCode Debugger is not an option.
What do you use to know what parameters came to the method?
My hope if you have a "magic" macro that will store all the variables with their names into a global?
And share your approaches, please?
I have multiple projects that I utilize when debugging in Cache Studio. One of my projects suddenly lost the ability to step through commands with the yellow box and the cursor moving though code lines. The cursor just sits at the entry line while variables apparently do change. Interestingly enough, if I change the project and the debug target, the "yellow box" ability is still there. Apparently losing this functionality is by project/debug target/whatever. The goal is, of course to return it back but how?
P.S.
Hey everyone!
I recently learnt something new while working with WRC on an issue, and I wanted to share with everyone on the off chance it could help someone else.
Files are being inexplicably written to a folder on your server and, due to the number of files in the folder and general system throughput, it is not possible to work through the files to track down the source.
Someone may have asked this before but is there a way to return the TRACE statements that we have placed in the Data transformation within the DTL Editor Testing Tool (EnsPortal.Dialog.TestTransform.cls)? Is this something we can get in an Enhancement request in for?
It would save sometime in troubleshooting where an error might be in the DTL.
Just wondering...
Thanks
Scott
Cache for UNIX (IBM AIX for System Power System-64) 2018.1.3 (Build 414U) Mon Oct 28 2019 11:24:02 EDT [HealthShare Modules:Core:15.032.9026 + Linkage Engine:15.032.9026]
In the WRC, we often see customers who have encountered a problem viewing their SOAP Catalog pages in a browser. This article will explain why the error is being encountered, as well as suggest a fix. This explanation is focused on the symptoms seen in InterSystems IRIS, but similar behavior can be seen in more recent versions of Caché.
The Problem:
You are trying to create new SOAP Web Services in InterSystems IRIS.
I come from Visual Studio and now I use mostly Cache 2017 Studio. One debugging functionality I miss dearly is current local variables automatically appearing in the Watch Variables window together with their values. Yes, I can hover or type them myself but both actions take extra time which is especially noticeable when debugging unfamiliar code across many routines. Any Cache settings or plugins to that effect? If not then why not? And if nothing else is there in Cache, what are the alternatives or hacks in this respect?
Anna
Hi i have rules and i want to log them to analyse what rules executed , I want to add in the log Msg Controller Id, MRN, Value coming in the message, and my customize text telling whats wrong with this field... i have like 50 rules and at the end i can check the log table and found like 20 entries so it means 20 data issues are there for a given message control id. any advice how to to do it
.png)
You might have encountered this and not known how to prevent it, or perhaps not even noticed it...
I am converting an object to json, but in the result a "_class" property appears, is there any way to remove this?
.png)
Result:
.png)
Running Cache 2017.2.2.
I'm trying to make a REST API call in JSON format. When using the example in the class reference documentation the getJSON method in the %Net.Http class throws the error <METHOD DOES NOT EXIST> on a %Clone() method in the %LIbrary.DynamicObject class. I even changed the parameter to a JSON string to no avail. The code will then fail on the %Compose method (examples below). My workaround is to use the %Net.HttpRequest functionality. Is there another workaround to this?
Example As Is:
USER>set continents = ##class(%Net.Http).