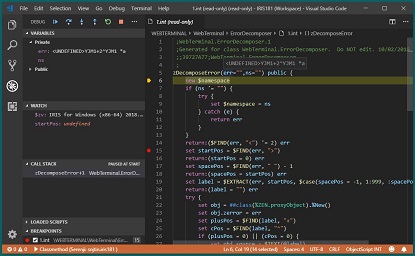
I have multiple projects that I utilize when debugging in Cache Studio. One of my projects suddenly lost the ability to step through commands with the yellow box and the cursor moving though code lines. The cursor just sits at the entry line while variables apparently do change. Interestingly enough, if I change the project and the debug target, the "yellow box" ability is still there. Apparently losing this functionality is by project/debug target/whatever. The goal is, of course to return it back but how?

0 24
0 737

Hi colleagues!

Yet another time I figured that there is no super-simple way to display error from %Status variable, but I need it relatively often in a terminal.

Yes, I know about $$$ Macro, but they are not superhelpful in a terminal.

My usual behavior is to try to remember by heart or copy from somewhere the formula:

USER>w $System.Status.DisplayError(st)

3 15
1 178
InterSystems Official
· Feb 27, 2023
VS Code ObjectScript releases v2.6.0

I'm pleased to announce version 2.6.0 of the VS Code ObjectScript extension, containing a number of enhancements that make a developer's life easier. Some highlights are described below. As always, find the full list of modifications in the CHANGELOG, including many bug and vulnerability fixes.

16 15
1 788

We at George James Software are pleased to announce that our acclaimed code debugger and editor Serenji is now available as a Visual Studio Code extension.

As well as supporting the latest InterSystems IRIS platform Serenji also works with earlier platforms, including versions lacking the server-side Atelier API support required by other VS Code extensions.

Serenji connects you directly to the code in your namespaces, resulting in an experience more familiar to existing Studio users. No need to export and import classes and routines.

We believe Serenji is the first extension to bring VS Code's powerful debugging features to ObjectScript developers.

5 13
3 1.3K

Hi Everyone,

New Coding Talk, recorded by @Evgeny Shvarov, is already on InterSystems Developers YouTube:

GitHub Repository Template To Develop and Debug ObjectScript in InterSystems IRIS

https://www.youtube.com/embed/PumOI3q5Gdk
[This is an embedded link, but you cannot view embedded content directly on the site because you have declined the cookies necessary to access it. To view embedded content, you would need to accept all cookies in your Cookies Settings]

9 13
3 577
Question
· Sep 11, 2020
Automatic Watch variables

I come from Visual Studio and now I use mostly Cache 2017 Studio. One debugging functionality I miss dearly is current local variables automatically appearing in the Watch Variables window together with their values. Yes, I can hover or type them myself but both actions take extra time which is especially noticeable when debugging unfamiliar code across many routines. Any Cache settings or plugins to that effect? If not then why not? And if nothing else is there in Cache, what are the alternatives or hacks in this respect?

Anna

0 12
0 376

If I open a terminal and type the following commands, sc is an error:

set validator = "sc = ##class(%Library.Numeric).IsValid(""BLAH"")"
set @validator
write sc

At the end, when I write sc I get:

0 L'BLAH9
             DOCXT010,#e^zIsValid+1^%Library.Numeric.1^1e^^^1

However, if I call the following class method using the arguments "%Library.Numeric" and "BLAH", sc is undefined

0 12
0 489

At the George James Software booth at Global Summit last year we took the wraps off the work we've been doing to make our popular editing and debugging tool Serenji available on the Visual Studio Code platform.

Rather than requiring you to pull code from your namespaces into local files, then push the changes back to the namespace to run it, you work directly in the namespace. In other words, the editing experience is like Studio rather than like Atelier.

As well as editing code you can also debug it directly from VSCode.

3 12
1 837

Hello,

Last weekend we've updated our Caché version to

Versie:Cache for Windows (x86-64) 2018.1.1 (Build 312U)

I'm using Studio to develop. I've been using the built-in debugger and it has been working nicely. But now, since the upgrade, I'm getting this error when trying to debug any routine or class method:

0 11
0 1K

Hello.

For debugging purposes I sometimes need to display stack information to the current device or save it (to a global for example).

There is this snippet offered in documentation:

ClassMethod StackToDisplay()
{
    For loop = 0:1:$Stack(-1) {
        Write !, "Context level:", loop, ?25, "Context type: ", $Stack(loop)
        Write !, ?5, "Current place: ", $Stack(loop, "PLACE")
        Write !, ?5, "Current source: ", $Stack(loop, "MCODE")
        Write !
    }
}

And to save stack to a global there's always an exception method:

0 11
0 1.6K
Question
· Oct 10, 2018
WebTerminal : blank screen

I just downloaded and installed the latest WebTerminal into my local copy of Healthshare 2016.2.1

I installed via studio and everything compiled without error.

However when I run it I just see a black screen. The help window at the bottom of the screen pops open when I type '/' but I just can't get any response.

Any suggestions as to how to trouble shoot this?

Mike

0 11
0 613

Hi,

I have a process that is importing lots of data from an external file, but every now and then I come across a STORE error.

I know that the STORE error is occurring in the %Save method of the class but I know very little else and I think its something to do with a lage amounts of Related Objects.

Is there a method of finding out more information regarding this error i.e. which actual object was being saved etc etc.

Thanks

Jim

0 9
0 2.8K

Hello,

I don't know if the title is accurate enough. I have a legacy code that I need to optimize. It's a routine written in objectscript. It accepts 4 parameters and runs 6 nested FOR...$ORDER reading a big global.

The thing is when I run the routine the first time it takes around 60 seconds to run. If I run it again it takes 5 seconds. If I wait around 6 to 10 minutes to run it again, it takes 60 seconds again, but if I run it every 1, 2, 3... minutes it still takes only 5 seconds to run.

0 9
0 575
Article
· Jun 13, 2016 1m read
Debug: using locks for breakpoints

Hi, Community!

Want to share with you one debugging approach from the Russian forum.

Suppose I want to debug the application and I want it to stop the execution on a particular line.

I add in code this line:

l +d,-d

When I want to start debugging in this line I block d in terminal

USER> l +d

And execute the app.

The app stops on this line and lets me connect to it with Studio debugger.

0 8
1 670

I need to see the full SMTP trace when a %Net.SMTP attempts to send an email to troubleshoot an issue. As far as I know, the only way to get that is to uncomment line 192 in the %Net.SMTP class.

 //:#define SMTPTRACE

I've done this in the past by giving myself the %DB_IRISSYS role, so I tried that. That database is also not mounted as read-only.

0 7
0 93

Is CR/LF changes to DTL files edited/committed to git via VS Code a known issue?

We had an issue with exporting files from one server and importing on another, using XML code exported from Studio: ERROR #6301: SAX XML Parser Error. Turns out that issue was down to CR/LF changes made when transferring the XML from one server to the other.

0 7
0 315

Context

I have created a Business Operation (BO) named "Sender" that sends HTTP messages to an endpoint (for testing, I'm using Postman's Mock Servers).

Goal: I want to set up an automatic timeout mechanism so that if I don't receive a response from the server within 18 seconds, an alert is generated and the message is resent. This process should be repeated every 18 seconds, for a maximum of 90 seconds. If no response is received within 90 seconds, I would like to generate an error message. On the other hand, if a response is received, I want to stop the resending process and complete the operation by indicating successful reception.

0 7
0 449
Question
· Apr 20, 2023
Uninstalling Ensemble

On a developer's laptop, having had two or three Ensemble installs with different settings/config changes made, and encountering unexplained errors compiling classes, wanting to scrub as much of the previous installs off the machine before doing any fresh installation... But can't find clear documentation on doing a complete uninstall!

Have stopped the server.

Am I safe to remove C:\InterSystems\Ensemble (for the instance installed into that folder)?

0 6
0 559