Article
· Nov 24 4m read
Journal File Indexer

Hi community!

In this article, I'm excited to introduce my latest application, Journal File Indexer. The development of this application is rooted in the portal idea DPI-I-270.

In short, this application lets you load and index a log file in a database.

Why?

If you've ever used the log file search function in the management portal, you may have encountered a timeout error or even a blank page. This problem usually occurs when searching a large journal file. Journal File Indexer solves this problem by considerably increasing the speed of searches once the file has been loaded into the database.

Another problem arises during the restoration process. When searching for global entries in a log file to restore old or new values, the management portal doesn't have this specific functionality. A routine must therefore be coded to achieve this. Journal File Indexer comes to the rescue, incorporating a restore function!

5 2
0 100

With the world (as well as our own technology) moving to the cloud at such a fast pace it is easy (at least for myself) to get caught up in the little details. One thing I, and some clients of ours, had run into a couple of times was the necessity to specify the version of the images one plans to use with the IKO.

7 4
1 280

Intro

If you ever wondered how to debug some requests that are being made to or from IRIS, well here is a little tutorial on how to do that.

During a complex project, usually you get the specifications and implement the communication between IRIS and other things based on that. But from the paper to the real world there's usually a huge gap and you need to know why you are receiving an error on a parameter, on a header, you are not receiving the data and so on.

6 1
2 258
Article
· Jan 23 2m read
Global-Streams-to-SQL

In general Global Streams are data objects embedded in Classes / Tables.
Using and viewing them with SQL is normally a part of the access to the containing tables.

SO WHAT?

During debugging or searching for strange or unexpected behavior there could be the need to
get closer to the stored stream. No big problem with direct access to Globals with SMP or Terminal.
But with SQL you are lost.
So my tool provides dynamic access to Global Streams wherever you may need this
Special thanks to @Oliver Wilms for the inspiration for this tool.

6 1
1 326
Article
· Jan 23 2m read
Global-Streams-to-SQL #2

Some technical background information

There is not just one class in this package: rcc.gstream.cls but also rcc.gstreamT.cls

While rcc.gstream works with direct access to the stream globals, the *T version uses
a Process Private Global (PPG) as Temporary storage.
using SELECT * FROM RCC.gstreamT WHERE RCC.useT('^jpgS')=1 and similar.

2 0
0 139

Hi Community,

I would like to share with you my experience regarding to debugging via Atelier.

I'm developing a REST API and would like to attach to a process when I call the API via a REST Client tool, for example Postman. The purpose is to inspect values from HEADER and BODY of the HTTP request during the debugging process.

Come on! How am I doing? I am going to demonstrate that by using a class from SAMPLES namespace.

1 - Open Atelier;

2 - Open your REST Service class;

3 - Go to the method related to the URI that you need to debug;

9 3
0 1.2K

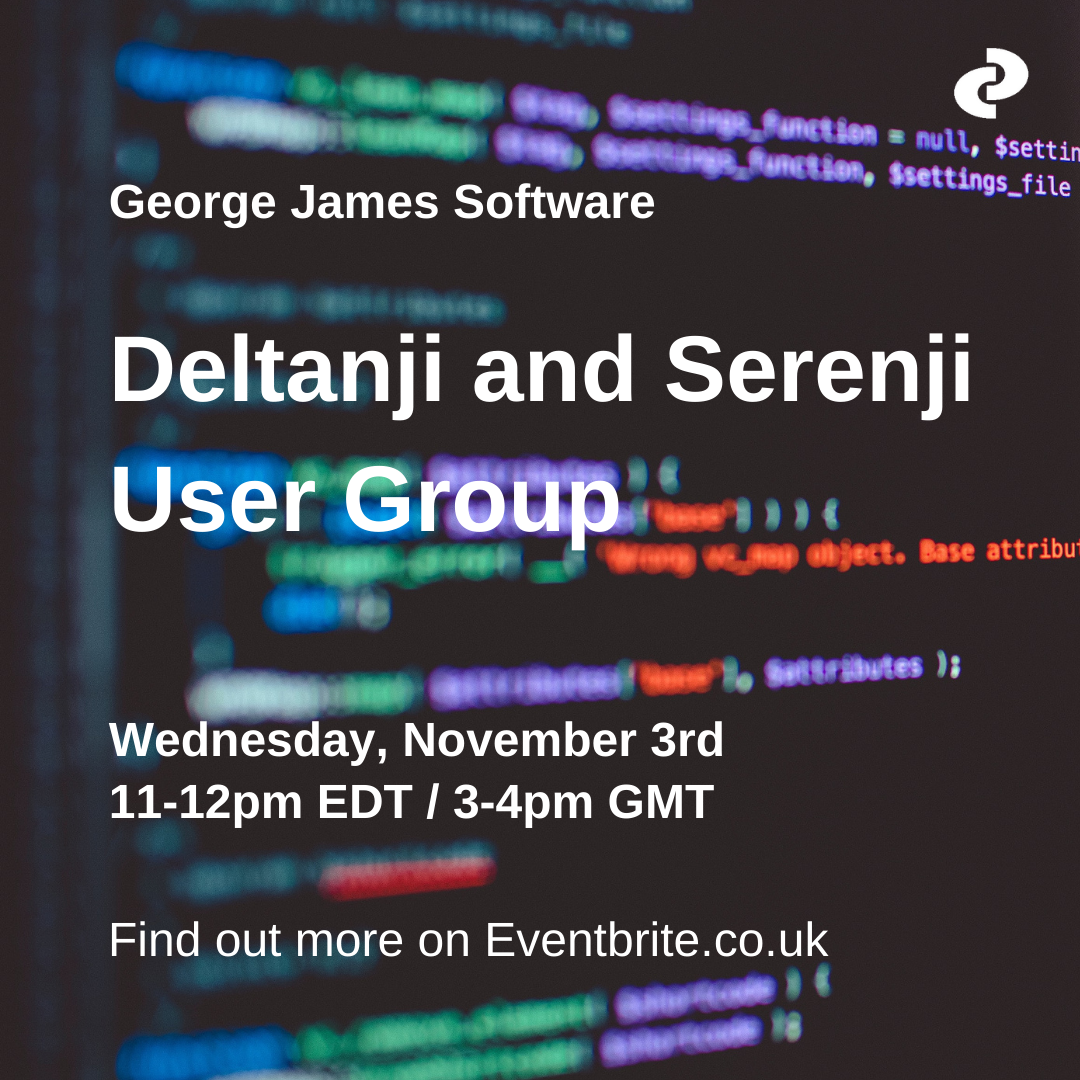
We're hosting our Deltanji and Serenji user group session tomorrow - there's still time to register, if you haven't already.

We'll be showcasing some advanced features of Deltanji and Serenji in VS Code with time for a discussion - so feel free to bring along any problems you need help solving or share your feedback on our tools. We'd love to hear your thoughts. If you're interested in our tools this is a great chance to hear what others have to say, as well as asking your own questions.

Date: Wednesday, November 3rd

Time: 11-12pm EDT / 3-4pm GMT.

Let us know you'll be attending on Eventbrite.

We hope to see you tomorrow, but if you're unable to make it you can email me at laurelj@georgejames.com and I can share a recording of the session.

0 0
0 113

The latest release of Serenji focuses on the debug experience. Not only can you now debug on the spot, no matter where you are or what you're doing, but we've also added some smaller features that will make debugging more straightforward. 

  • Run and Debug CodeLenses - clickable links above each class method, procedure, subroutine or extrinsic function.
  • Intuitive prompting for entrypoints and arguments - when debugging a class method, produce, subroutine or extrinsic function. 
  • Shaded read-only background - to clearly differentiate between documents which are editable and those that are read-only. 
  • Program output in debug console - output is shown in the debug console. 
  • Serenji commands on Server Manager's namespace trees - allowing you to launch Serenji through Server Manager. 

Find out more in our release notes here

1 0
1 225

Hi developers, 

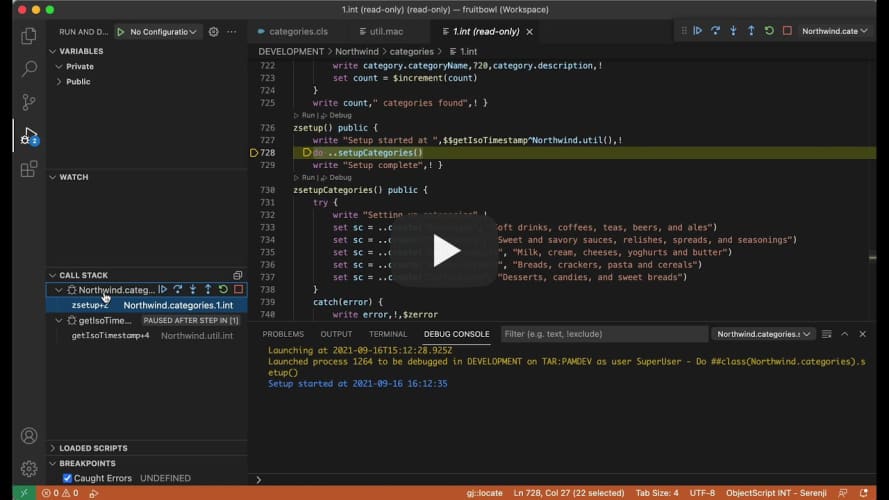
We've incorporated VS Code's support for multiple concurrent debug sessions and consoles into the latest release of Serenji

So if you're working with processes that relate or are dependent on each other, you can now debug them together. Just launch a second Serenji debug session (F5) whilst the first one is still active. 

This short video below shows how it works. We hope you find this feature useful! 

Laurel 

Serenji 3.2 multiple concurrent debug sessions

0 0
0 147

The most recent release of Serenji features our innovative gj::locate technology. It was a standalone tool we originally created for a Developer Community contest earlier this year, but we've incorporated it into our debugger after some great feedback from developers. 

It works by navigating you directly to the source of your server-side errors in just a couple of clicks - enabling you to quickly fix errors without the need to count tedious lines of code... and let's be real, who has got time for that when you're under pressure to fix this bug? 

It's simple and straightforward to use:

1. Click on the gj::locate panel in the status bar

2. Enter the ObjectScript error message or line reference from a class/.mac routine..

3. gj::locate then does the work for you by taking you straight to the corresponding line in your source code.

Easy peasy... and with time to spare to make yourself a coffee before your deadline! 

The video below shows it in action - let us know if you've already given it a go. Or, if you're interested in trying it out we offer a free 30 day trial license, just drop me a message through the Developer Community or email us at info@georgejames.com.
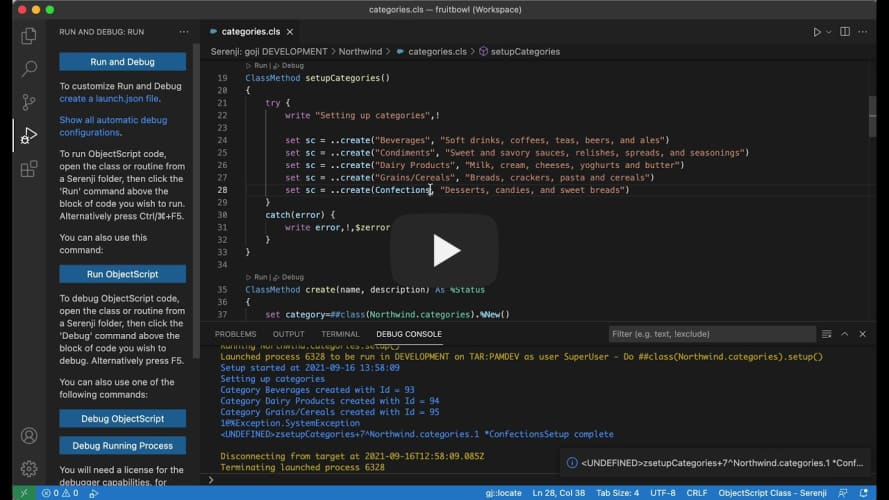
Serenji 3.2.0 utilising gj::locate technology

2 0
0 182

Hi developers, 

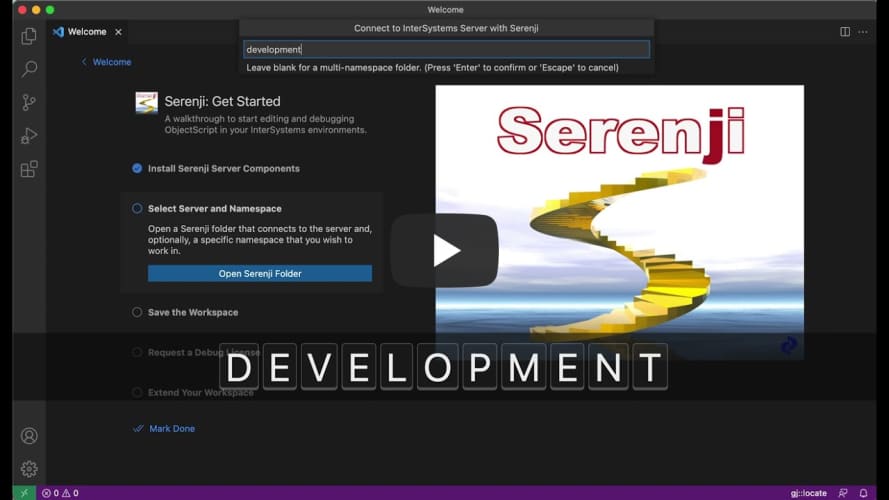
Serenji 3.2.0, the latest version from George James Software, was released last week and our current users have been enjoying trying out the new features (which you can find more about here). 

If you're thinking about trying Serenji for the first time, we've made it easier to get set up by adding a walkthrough on the VS Code Welcome page. It takes you through: 

  • Setting up the server components.
  • Selecting a server namespace.
  • Saving and extending your workspace.
  • Requesting a debug license (don't forget we offer a free 30 day trial!) 

We've also added prompts and guidance throughout VS Code to open and add Serenji folders to your workspace and when going to run and debug code. 

This is just one of the ways we've enhanced the Serenji debugger to make straightforward and easy to use - so all you need to do is focus on your code. 

Serenji 3.2.0 Welcome Page Walkthrough

1 0
0 158
Article
· Sep 23, 2021 1m read
Zero configuration debugging

The latest release of Serenji by George James Software introduces zero configuration debugging, so it's ready to go in just one click - no matter where you are or what you're doing, your on-the-spot debugger is ready to go. 

We have introduced a host of new features to enhance the debugging experience so you can focus on identifying and fixing errors, without losing focus by spending time setting up a launch configuration. 

Check out the new features in our release notes

If you've already started using Serenji 3.2.0 let us know how you're getting on! 

3 0
2 190
Article
· Apr 20, 2021 3m read
Why gj :: locate?

You may think it isn’t too difficult to get from label+offset^routine to the actual source line responsible for the error. For an expert it isn't that hard... most of the time. But there are enough oddities and special rules that even an expert can get it wrong, whilst spending a lot of time trying to get there.

gj :: locate is the latest tool from George James Software – it debugs any error, class or routine by converting the location of an error in compiled .int code to the corresponding location in your source, and then taking you right there.

Image this scenario…

4 0
1 178
Article
· Jul 4, 2020 2m read
Terminal Multi-Line Command Editor

The Command extension enables the execution of Multi-Line Commands from Terminal prompt.

Terminal Multi-Line Input with Edit, Insert, Delete, Print extension for IRIS and Caché
IRIS and Caché have just single command lines in terminal available
This Multi-Line Commands Editor also will execute the Multi-line Commands.
In addition, it is independent of access to %SYS and can be installed in any namespace

Special thanks to @Jeffrey Drumm who inspired me to this and supported me as beta-tester.

8 1
0 1.1K

Hey everyone!

I recently learnt something new while working with WRC on an issue, and I wanted to share with everyone on the off chance it could help someone else.

Scenario:

Files are being inexplicably written to a folder on your server and, due to the number of files in the folder and general system throughput, it is not possible to work through the files to track down the source.

4 0
0 287

In the WRC, we frequently see customers contact us because their Web Gateway is unable to serve web pages. This article will explain a frequent reason why these errors can occur, and explain some tools which can be used to debug the problem. This explanation is focused on the Web Gateway serving InterSystems IRIS instances, but the same explanation should apply to the CSP Gateway serving Caché instances as well.

4 0
1 1.7K
Article
· Jun 18, 2020 1m read
Debugging Business Operations

Often we need to debug a Business Operation. Tracing and logging work but sometimes you want to work with a BO as with your local terminal session.

Here's how you can do that on any operating system.

Windows has a great tool for debugging Business Operations - Foreground mode. In that mode Windows launches a local terminal with operation job.

2 0
1 388

Hi ObjectScript developers!

How to Protect Your Belongings from Pests While Moving - Delicate ...

InterSystems ObjectScript is perhaps the best language on the planet to deal with globals - and it is an interpretable language.

Yes, it has a compiler. But even the compiler can compile some lines in ObjectScript which will then fire as bugs during the runtime.

There are some technics on how to avoid that such as unit testing, coding guidelines and your coding experience, of course ;)

Here I want to present to you the yet another approach to how you can reduce the number of errors in your ObjectScript runtime and enforce coding guidelines - it's an ObjectScript Quality tool developed by Lite Solutions, InterSystems solution partner.

See the details below.

4 0
0 391

The %Net.SSH.Session class lets you connect to servers using SSH. It's most commonly used with SFTP, especially in the FTP inbound and outbound adaptors.

In this article, I'm going to give a quick example of how to connect to an SSH server using the class, describe your options for authenticating, and how to debug when things go wrong.

Here's an example of making the connection:

10 3
0 5.2K

Every developer has made the mistake of accidentally leaving temporary debug code in place when they meant to remove it after debugging is complete. The great thing about writing in ObjectScript is that there is a way to make temporary code be truly temporary and automatically self-destruct! This can also be done in such a way that the code has no change of making it into your source control stream, which can be helpful as well.

3 1
0 360

This is more for my memory that anything else but I thought I'd share it because it often comes up in comments, but is not in the InterSystems documentation.

There is a wonderful utility called ^REDEBUG that increases the level of logging going into mgr\cconsole.log.

You activate it by

a) start terminal/login

b) zn "%SYS"

c) do ^REDEBUG

6 0
0 1K
Article
· Oct 1, 2018 4m read
Profiling code using Caché Monitor

Not everyone knows that InterSystems Caché has a built-in tool for code profiling called Caché Monitor.

Its main purpose (obviously) is the collection of statistics for programs running in Caché. It can provide statistics by program, as well as detailed Line-by-Line statistics for each program.

Using Caché Monitor

Let’s take a look at a potential use case for Caché Monitor and its key features. So, in order to start the profiler, you need to go to the terminal and switch to the namespace that you want to monitor, then launch the %SYS.MONLBL system routine:

3 1
7 893

One of the most important features during application development is the ability to debug your code easily. Because of the asynchrnous nature, a standard Node.js application server works single-threaded by default. When you are developing applications using an IDE like Visual Studio Code, you can very easily debug your Node.js process:

First, download the free Visual Studio Code IDE (@code) and install it on your development machine.

3 0
0 1.9K