This tag relates to the discussions on the development of analytics and business intelligence solutions, visualization, KPI and other business metrics management.
Following up the previous part, it's time to take advantages for IntegratedML VALIDATION MODEL statement, to provide information in order to monitor your ML models. You can watch it in action here
This is my introduction to a series of posts explaining how to create an end-to-end Machine Learning system.
Starting with one problem
Our IRIS Development Community has several posts without tags or wrong tagged. As the posts keep growing the organization
of each tag and the experience of any community member browsing the subjects tends to decrease.
First solutions in mind
We can think some usual solutions for this scenario, like:
Now available on Open Exchange is a library of third party charts available to use within DeepSee/InterSystems IRIS BI dashboards. To start, simply download and install, select the new portlet as the widget type, then select the chart type that you desire. If you don't find the type of chart you are looking for, you can easily extend the portlet to implement your desired chart type. These new chart types can be used within existing dashboards or you can create new dashboards using them.
A few months ago I touched on a brief note on "Python JDBC connection into IRIS", and since then I referred to it more frequently than my own scratchpad hidden deep in my PC. Hence, here comes up another 5-minute note on how to make "Python ODBC connection into IRIS".
How to use the IRIS Native API in Python to access globals and plot some charts.
Why Python?
With a large adoption and use in the world, Python have a great community and a lot of accelerators | libraries to deploy any kind of application.
If you are curious (https://www.python.org/about/apps/)
Preview releases are now available for InterSystems IRIS Advanced Analytics, and InterSystems IRIS for Health Advanced Analytics! The Advanced Analytics add-on for InterSystems IRIS introduces IntegratedML as a key new feature.
In this first installment of InterSystems IRIS 2020.1 Tech Talks, we put the spotlight on data science, machine learning (ML), and analytics. InterSystems IntegratedMLTM brings automated machine learning to SQL developers. We'll show you how this technology supports feature engineering and chooses the most appropriate ML model for your data, all from the comfort of a SQL interface. We'll also talk about what's new in our open analytics offerings. Finally, we'll share some big news about InterSystems Reports, our "pixel-perfect" reporting option. See how you can now generate beautiful reports and export to PDF, Excel, or HTML.
In Episode 7 of Data Points, product manager @Carmen Logue joined the pod to tell us all about InterSystems Reports — the new reporting feature of InterSystems IRIS! Take a listen to hear about its capabilities, use cases, and how it fits into the existing set of analytics technologies.
https://5e18edf067eb59-03854285.castos.com/player/172127 [This is an embedded link, but you cannot view embedded content directly on the site because you have declined the cookies necessary to access it. To view embedded content, you would need to accept all cookies in your Cookies Settings]
I'm happy to announce the release of the interface to Julia programming language for InterSystems IRIS. Execute Julia code and more from InterSystems IRIS.
This project brings you the power of Julia right into your InterSystems IRIS environment:
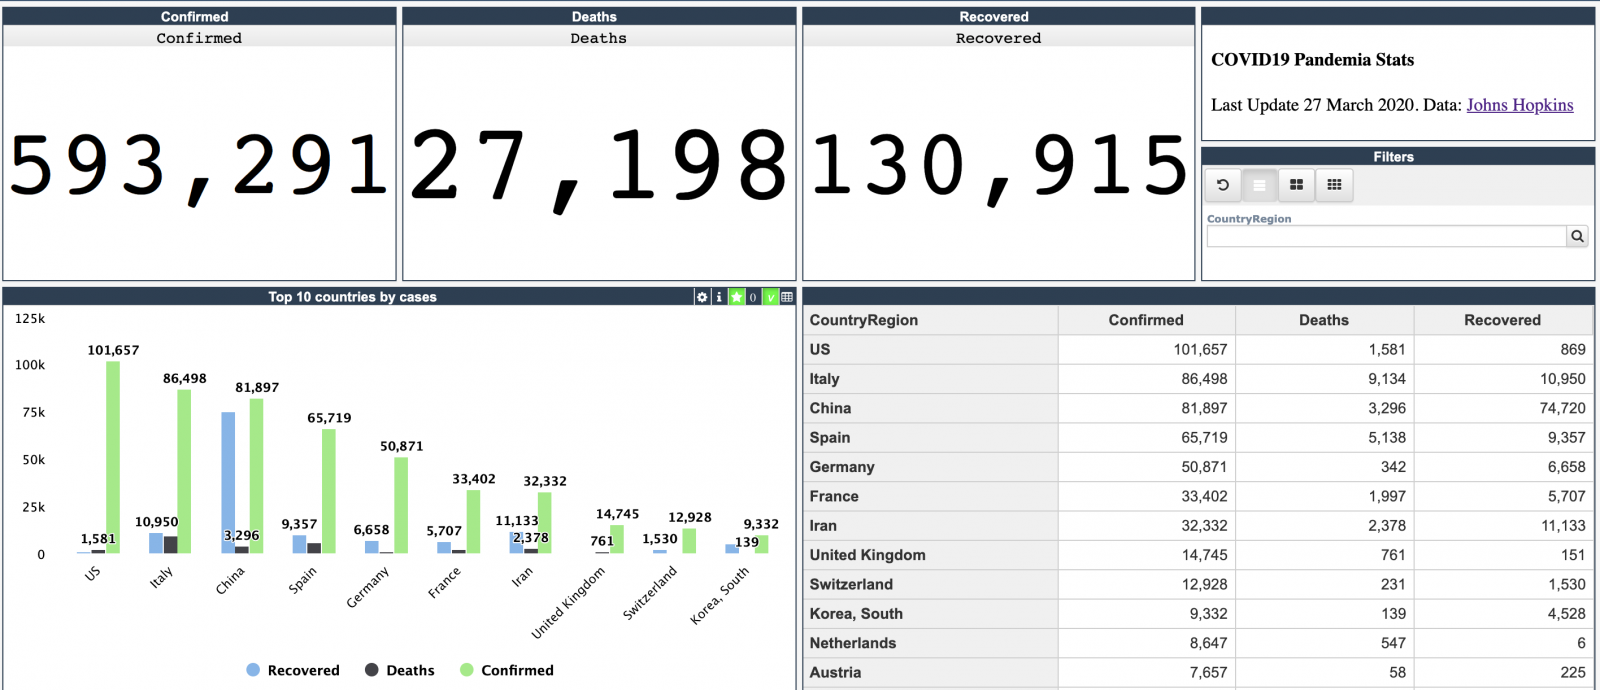
Every day Johns Hopkins University publishes new data on coronavirus COVID-19 pandemic status.
I built a simple InterSystems IRIS Analytics dashboard using InterSystems IRIS Community Edition in docker deployed on GCP Kubernetes which shows key measures of the disease outbreak.
This dashboard is an example of how information from CSV could be analyzed with IRIS Analytics and deployed to GCP Kubernetes in a form of InterSystems IRIS Community Edition.
InterSystems IRIS Business Intelligence allows you to keep your cubes up to date in multiple ways. This article will cover building vs synchronizing. There are also ways to manually keep cubes up to date, but these are very special cases and almost always cubes are kept current by building or synchronizing.
This error is sometimes seen while viewing a listing in InterSystems IRIS Business Intelligence: ERROR #5540: SQLCODE: -99 Message: User <USERNAME> is not privileged for the operation (4)
As the error suggests, this is due to a permission error. To figure out which permissions are missing/needed, we can take a look at the SQL query that is generated. We will use a query from SAMPLES as an example.
Preview Mode was added to InterSystems IRIS Business Intelligence to give designers a quick view of what their resulting Pivot Table will look like without needing to wait for the results to fully execute. This can be beneficial when designing pivot tables because if you are dragging and dropping elements to see how they look/work in your pivot table and seeing if they have the desired data. Since you are exploring and designing, you don't necessarily care about the results at the moment, but you would still like to see how your table looks with the changes you have made.
Thank you all for your continued feedback and support of our ad hoc reporting platform, VDM. There's been some questions around setting up a non-ODBC connection for InterSystems platforms. We published a new YouTube video showing the steps necessary to connect to InterSystems Caché and InterSystems IRIS with BridgeWorks VDM.
Over the last couple of weeks the Solution Architecture team has been working to finish off our 2019 workload: this included open-sourcing the Readmission Demo that was brought to HIMSS last year, so we could make it available to anyone looking for an interactive-way of exploring the tooling provided by IRIS.
Hi there, We need your help, in the build pivot with DMX, we don't can run the pivot. The MDX use is:
WITH MEMBER [Measures].[CondicionesContCompleta] AS ( IIf([Measures].[CondicionesContCompleta] = Null, 0,[Measures].[CondicionesContCompleta] ) ) SELECT NON EMPTY ( [Gerencia].Gerencia].[Gerencia] ) ON ROWS, NON EMPTY ( [Measures].[CondicionesContCompleta] ) ON COLUMNS FROM [Condiciones]
and when we executed the pivot display the next dialog.
Error#5001: Expected operator within tuple: ('SELECT' @pos 156)(2)
Hi All,
We have been using DeepSee which has been the integrated Analytic Dashboard built over Cache Cubes. It works fine but it's visual capabilities are limited and most probably is getting phased out.
If I am not wrong, Tableau is the suggested alternative to DeepSee . It is expensive and a big and considerable shift from existing technology
I wanted to get an opinion of the community as to these few key points
- What other BI tools others have been using with IRIS and what have been their experience
- For which tools are the best inbuilt support / api's avaialble in IRIS
In the previous part of this series, we saw how to include data in a portlet from within DeepSee. This used the built in data controller. In this part, we are going to be pulling in data from outside of DeepSee. This will include both information from within InterSystems IRIS and from the OS.
Why use this?
This is useful if you would like to create a dashboard that only contains information about your system. It is also useful if you want to display data about your system along side data that you have stored in DeepSee.
When using Related Cubes in InterSystems IRIS BI, cubes must be built in the proper order. The One side must be built before the Many side. This is because during build time for the Many side, it looks up the record on the One side and creates a link. If the referenced record is not found on the One side, a Missing Relationship build error is generated. The One side is going to be the independent side of the relationship, AKA the side of the relationship that is referenced by the Many side or the Dependent cube. For example: Patients contain a reference to their Doctor.
https://www.youtube.com/embed/tl7heBWRrVQ [This is an embedded link, but you cannot view embedded content directly on the site because you have declined the cookies necessary to access it. To view embedded content, you would need to accept all cookies in your Cookies Settings]
%SQLRESTRICT is a special %FILTER clause for use in MDX queries in InterSystems IRIS Business Intelligence. Since this function begins with %, it means this is a special MDX extension created by InterSystems. It allows users to insert an SQL statement that will be used to restrict the returned records in the MDX Result Set. This SQL statement must return a set of Source Record IDs to limit the results by. Please see the documentation for more information.
Why is this useful?
This is useful because there are often times users want to restrict the results in their MDX Result Set based on information that is not in their cubes. It may be the case that this information may not make sense to be in the cube. Other times this can be useful when there is a large set of values you want to restrict. As mentioned before, this is not a standard MDX function, it was created by InterSystems to handle cases were queries were not performing well or cases that were not easily solved by existing functions.
 By date
 Open Exchange app
.png)