IRIS BI

We offer you to embed business intelligence into your applications in order to give your users an opportunity to ask and answer sophisticated questions about their data. Typically, your application will include customizable dashboards that can provide insight into data from Business Intelligence models known as cubes.

In contrast with traditional BI systems that use static data warehouses, Business Intelligence keeps being constantly synchronized with the live transactional data.

5 2
0 567
Article
· Jul 4, 2023 2m read
IntegratedMLandDashboardSample

A simple data analysis example created in IntegratedML and Dashboard

Based on InterSystems' Integrated ML technology and Dashboard, automatically generate relevant predictions and BI pages based on uploaded CSV files. The front and back ends are completed in Vue and Iris, allowing users to generate their desired data prediction and analysis pages with simple operations and make decisions based on them.

# ZPM installation

zpm:USER>install IntegratedMLandDashboardSample

# Process Deployment

3 2
0 241

In today's data landscape, businesses encounter a number of different challenges. One of them is to do analytics on top of unified and harmonized data layer available to all the consumers. A layer that can deliver the same answers to the same questions irrelative to the dialect or tool being used.

11 2
1 459
Article
· Jul 27, 2018 4m read
Load a ML model into InterSystems IRIS

Hi all. Today we are going to upload a ML model into IRIS Manager and test it.

Note: I have done the following on Ubuntu 18.04, Apache Zeppelin 0.8.0, Python 3.6.5.

Introduction

These days many available different tools for Data Mining enable you to develop predictive models and analyze the data you have with unprecedented ease. InterSystems IRIS Data Platform provide a stable foundation for your big data and fast data applications, providing interoperability with modern DataMining tools.

6 2
2 1.4K

We have created a custom SDA container to store a certain kind of new, customized patient data.

We are observing a behavior in the correspoding analytics table for this custom SDA class where rows are added for a patient for which the MPI is null and the patient record does not exist.

0 2
0 313

The source class of a DeepSee cube has a property referencing a different class:

Class ClassA Extends %Persistent {
     Property P1 As ClassB;
}

When records in class B change, the ^OBJ.DSTIME global for Class A will not be automatically updated. This means that synchronization of cubes based on source class A will not reflect the changes occurred to property P1.
This post will help you determine the best way to achieve synchronization of properties referencing a different class

4 2
2 512

Hi

I have a pvot table defined. that generates a set of data. I want. to. execute the pivot table programatically which I believe involves using %DeepSee.ResultSet. Does someone have an example showing how to apply filters to the results?

For. example

[DateTime of Filing].[Date].[Date Filed Year] = &[2023]

Thanks

0 2
0 258

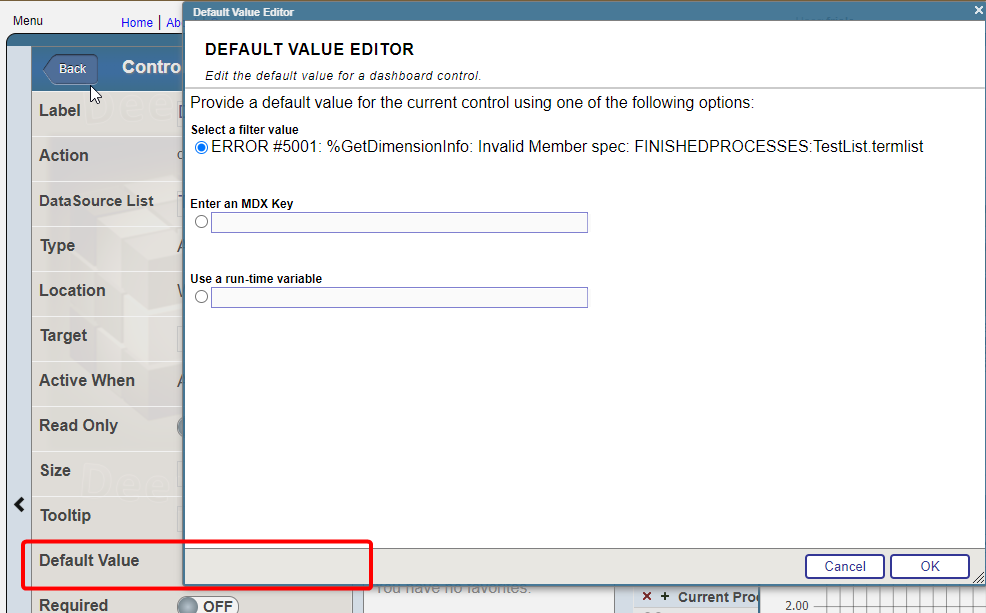
I have a widget that uses "choose Data source" control option. Termlist for the control consist of the two data sources and i want to set one of them by default. For example: I have two data sources, one is grouped by month, the other by year. I need to set the one that is grouped by year by default

Using default value at the bottom return an error

How can i achive that?

0 2
0 37

With the release of InterSystems IRIS, we're also making available a nifty bit of software that allows you to get the best out of your InterSystems IRIS cluster when working with Apache Spark for data processing, machine learning and other data-heavy fun. Let's take a closer look at how we're making your life as a Data Scientist easier, as you're probably already facing tough big data challenges already, just from the influx of job offers in your inbox!

2 2
0 1.7K

Hi Community,

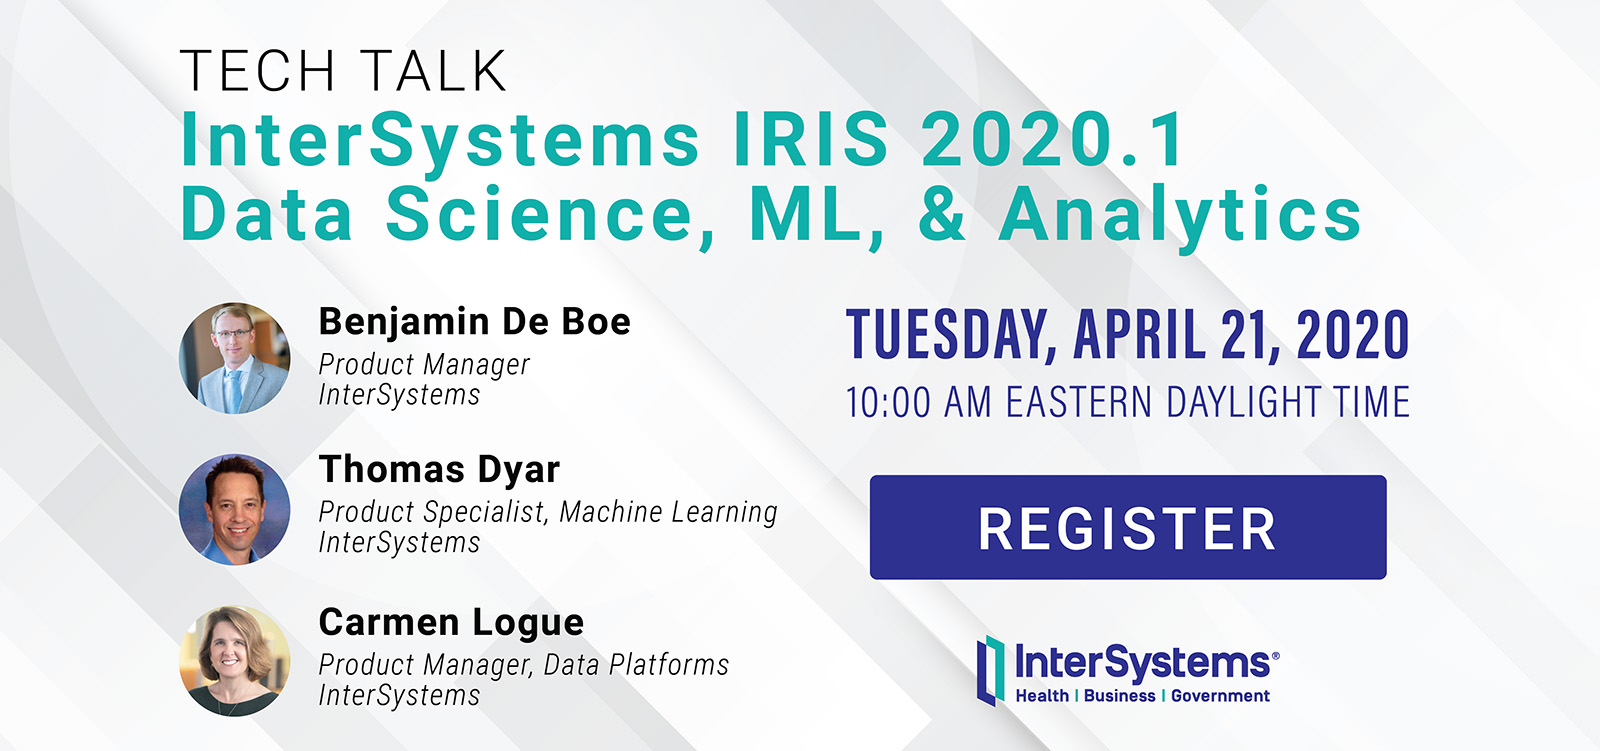
We're pleased to invite you to join the upcoming InterSystems IRIS 2020.1 Tech Talk: Data Science, ML & Analytics on April 21st at 10:00 AM EDT!

In this first installment of InterSystems IRIS 2020.1 Tech Talks, we put the spotlight on data science, machine learning (ML), and analytics. InterSystems IntegratedMLTM brings automated machine learning to SQL developers. We'll show you how this technology supports feature engineering and chooses the most appropriate ML model for your data, all from the comfort of a SQL interface. We'll also talk about what's new in our open analytics offerings. Finally, we'll share some big news about InterSystems Reports, our "pixel-perfect" reporting option. See how you can now generate beautiful reports and export to PDF, Excel, or HTML.

3 2
1 440

I have an SDA feed from an Edge server that eventually is fed into HSHI / Analytics. This edge server is loading up patient demographics (in the Patient object), which feeds the HSAA.Patient table in HSHI / Analytics.

However, we have other edge servers also feeding into the same HSHI database, and these other edge servers have better demographic information.

1 2
0 368

Hey Community!

The latest webinar, recorded by InterSystems Sales Engineers @Sergey Lukyanchikov and @Eduard Lebedyuk, is already on InterSystems Developers YouTube! Please welcome:

"Machine Learning Toolkit (Python, ObjectScript, Interoperability, Analytics) for InterSystems IRIS"

https://www.youtube.com/embed/z9O0F1ovBUY
[This is an embedded link, but you cannot view embedded content directly on the site because you have declined the cookies necessary to access it. To view embedded content, you would need to accept all cookies in your Cookies Settings]

2 2
1 440

When creating pivots in DeepSee, there is the ability to group date dimensions by Day, Week, Month, Quarter, Year. For some of our reporting the Week option is desired. However the display looks like the image shown below. Notice the "YYYYW##" formatting.

Is there any ability within DeepSee to modify the display of grouped week dates? E.g. instead of 2020W14 it could be 03/30/2020-04/05-2020, or even just the start or end date, etc.

0 2
1 177
Article
· Feb 13, 2023 4m read
When to use Columnar Storage

With InterSystems IRIS 2022.2, we introduced Columnar Storage as a new option for persisting your IRIS SQL tables that can boost your analytical queries by an order of magnitude. The capability is marked as experimental in 2022.2 and 2022.3, but will "graduate" to a fully supported production capability in the upcoming 2023.1 release.

The product documentation and this introductory video, already describe the differences between row storage, still the default on IRIS and used throughout our customer base, and columnar table storage and provide high-level guidance on choosing the appropriate storage layout for your use case. In this article, we'll elaborate on this subject and share some recommendations based on industry-practice modelling principles, internal testing, and feedback from Early Access Program participants.

14 2
2 663

Hello!

My group and I are currently doing a research project on natural language processing and iKnow plays a big role in this project. I am aware that the algorithms iKnow use aren't public, and I respect that.

My question is, are there any public documents/research that explains, at least part of, the algorthims iKnow uses and the motivations for using them?

1 2
0 421

Hi, I'm new to the Analytics world in Intersystems and was attempting to print and/or export selected rows from a detail listing in a pivot on a dashboard. I am able to print and/or export all the rows; but if I select a specific set of rows, it prints out the entire detail listing; not the selected rows. Please advise on the best approach to accomplish this task. Thanks.

0 2
0 101