 By replies
I am receiving Mirroring updates to an IRIS for Health async reporting server and need to pause the mirroring journal processing to periodically quiesce the database to rebuild cubes and custom staging tables.
What API or web service can I use to quiesce the reporting server and then later initiate catch up?
 Open Exchange app
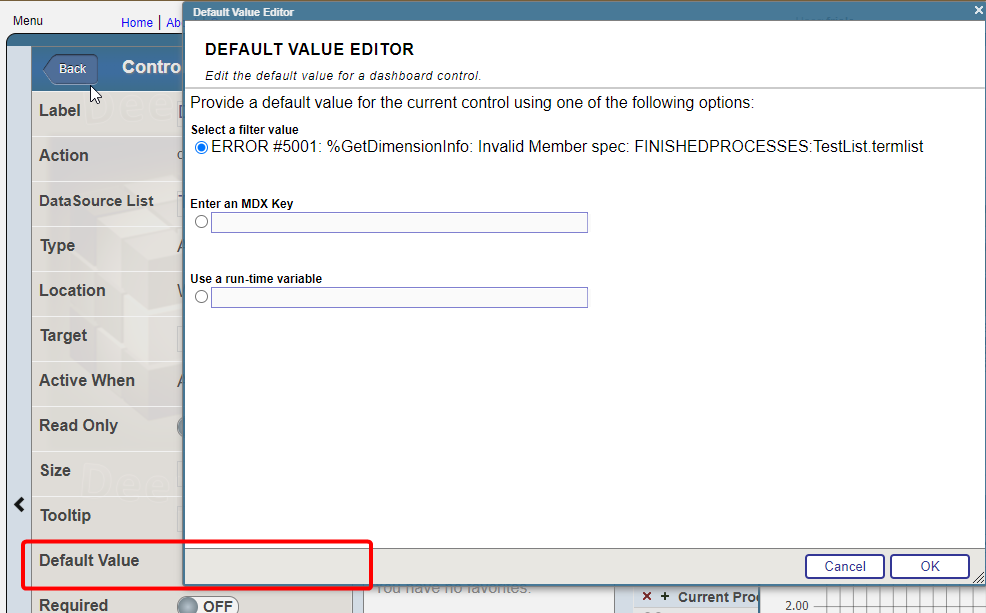

.png)
.png)