Today we will talk about Adaptive Analytics. This is a system that allows you to receive data from various sources with a relativistic data structure and create OLAP cubes based on this data. This system also provides the ability to filter and aggregate data and has mechanisms to speed up the work of analytical queries.
.png)
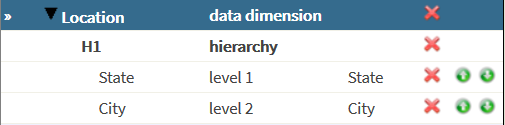
Let's take a look at the path that data takes from input to output in Adaptive Analytics. We will start by connecting to a data source - our instance of IRIS.
.png)