When analyzing data, there is often a need to look at specific indicators more thoroughly and to highlight sections of information of particular interest to a user.

For instance, examining the data dynamics for specific regions or dates can help us uncover some hidden trends and patterns that will allow us to make an informed decision about our project in the future.

1 0
1 247

I need to pass multiple values to a FILTER to a DeepSee DASHBOARD via the URL. The documentation seems to indicate this can be done, i.e.: "Where each filterspec is filter_name.filter_values" but there are no examples I can find that indicates what is used to separate multiple values. Say I want to pass the three values 5, 6, and 1395 to a filter. To pass just the 5 I know this works:

&SETTINGS=FILTER:LEAD.MYUSERID.H1.MYUSERID.5

but how do I include 6 and 1395. None of the following seem to work:

&SETTINGS=FILTER:LEAD.MYUSERID.H1.MYUSERID.5.6.1395

1 2
0 368

Hi everyone,

I'm creating something to test the Analytics capabilities.

I have a table with 100k records. Consulting the data using ^%G or SELECT, everything is working fine.

But, when I create a Cube using this same class as Source, the Build results in only 1 fact.

I would like to know if anyone else faces the same situation before and have some guidance.

Some details:

1 6
0 228

Users of analytical applications often need to generate and send out PDF reports comprised of elements of the analytical panel. In the InterSystems stack, this task is solved using the DSW Reports project that is an extension of DeepSeeWeb. In this article, we will explain how to use DSW Reports for generating PDF reports and emailing them.

1 0
1 499

Hi!

Sometimes I need to filter the widget on a dashboard from a different cube. And I face the following problem:

Widget A refers to a query from Cube A and I want to filter Widget B from Widget B.

Widget's B pivot refers to Cube B, and which has different dimensions for the same data.

E.g. cube A has the dimension Author and the Cube B has the dimension Member for the same data. So there is no way to filter such a widget B from the widget A.

1 1
1 313

In the previous part of this series, we saw how to define a basic portlet. Now we will look into making this portlet reference a web page that will enhance our dashboard experience.

In this example, we will be embedding a Developer Community article along side a couple of widgets displaying information related to the number of views on the Developer Community articles. This example is not hosted on the Community Analytics server, but if it was we could see the view counts going up as we interacted with the page.

Why use this?

In a real case, perhaps you have an embedded page from an external web site showing the current Emergency Room wait times for Hospitals in your area. This portlet can be used along side widgets from your Emergency Room showing how many people are waiting, how many doctors are active, and how many people are being treated. As other Emergency Room wait times grow, you can possibly expect your volume to increase as well. This can help you make decisions on how to allocate resources.

1 0
0 369
Question
· Aug 3, 2017
DeepSee time series - season

Hello,

I have a series of data organized by time (year and month) so I can use a time dimension to drill down data. So far so good.

However, I need to display the data not by calendar years and months but rather by seasons. The season has 12 calendar months but starts in September. So I'd like to see the data from September / Year N to August / Year N+1 using the same hierarchy as normal time dimension.

Has anyone done something similar?

Obviously, the season can start by any month, not only September :)

TIA!

1 3
0 255

Power BI dashboards provide us with a good way to analyze aggregated information. We can even choose time periods for aggregation (you can find more details regarding it in our article about drill down). However, we might still be interested in a detailed look at specific data points. With the right data filling, we can display detailed data for any column of the chart with all filters applied to that chart.

1 0
0 815

I created a new class DSW.Addons.htmlViewer:

Class DSW.Addons.htmlViewer Extends %DeepSee.Component.Portlet.abstractPortlet
{

Property Data As %String;

ClassMethod %OnGetPortletSettings(Output pInfo As %List, ByRef pSettings) As %Status
{
    Kill pInfo
    Set pInfo(1) = $lb("Data", , , "Data", "Data setting")
    Quit $$$OK
}
}

It's a ZEN component and DeepSee portlet. It's immediately available in the namespace I created it in. DSW package is mapped to %ALL and to Samples, but if I try to create a widget with this portlet I get ZEN class not found error.

1 2
0 305

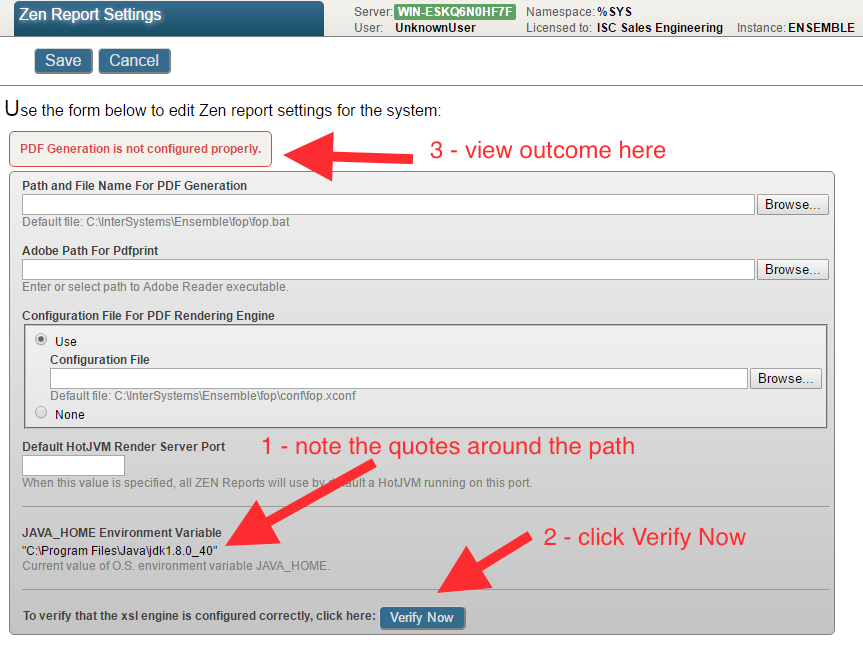
You may experience errors executing Java programs that rely on the JAVA_HOME environment.

For example when Create PDF from this pivot in DeepSee or in this case, outputting a Zen Report as PDF.

You can verify the PDF generation configuration by clicking on the Verify Now button on the Management Portal System > Configuration > Zen Report Settings page:

1 0
0 747

Hi Developers!

Here're the technology bonuses for the InterSystems Analytics contest that will give you extra points in the voting.

Adaptive Analytics (AtScale) Cubes usage - 4 points
InterSystems Adaptive Analytics provides the option to create and use AtScale cubes for analytics solutions.

You can use the AtScale server we set up for the contest (URL and credentials can be collected in the Discord Channel) to use cubes or create a new one and connect to your IRIS server via JDBC.

The visualization layer for your Analytics solution with AtScale can be crafted with Tableau, PowerBI, Excel, or Logi.

Documentation, AtScale documentation

Training

1 0
0 251

Hi Community,

Play the new video on InterSystems Developers YouTube:

InterSystems IRIS Business Intelligence - Tips & Tricks @ Global Summit 2023

https://www.youtube.com/embed/Ekjzny8zj98
[This is an embedded link, but you cannot view embedded content directly on the site because you have declined the cookies necessary to access it. To view embedded content, you would need to accept all cookies in your Cookies Settings]

1 0
0 78
Announcement
· Dec 10, 2015
Welcome to the DeepSee Group

Welcome to the DeepSee Group.

The Developer Communty has a lot of DeepSee content including all the DeepSee documentation and over 50 videos.

Please use the Developer Community to asks questions, share your experience, and learn more about DeepSee.

I look forward to your participaton in the DeepSee Group of the InterSystems Developer Community.

Joe Gallant

Senior Product Manager

1 0
0 226

I have a DeepSee KPI defined based on %DeepSee.KPI following the documentation http://docs.intersystems.com/latest/csp/docbook/DocBook.UI.Page.cls?KEY=.... I've then enabled the KPI on a dashboard by adding a Widget where the data source is the KPI. Currently the ability to show a Detail Listing is implemented by the call back %OnGetListingSQL. This method documents the parameter

1 2
0 302

Hi all,

I have a dashboard which shows the growth of the months compared with the month from the last year.

The way I found to develop that, it was with a kpi. So, I overrode the %OnLoadKPI method with two mdx:

SELECT NON EMPTY [DataD].[H1].[MothYear].Members ON ROWS, [Measures].[CountVisits] ON COLUMNS FROM SubjectAtendimento %FILTER [DataD].[H1].[Year].&[2016]

SELECT NON EMPTY [DataD].[H1].[MonthYear].Members ON ROWS, [Measures].[CountVisits] ON COLUMNS FROM SubjectAtendimento %FILTER [DataD].[H1].[Year].&[2015]

1 5
0 368