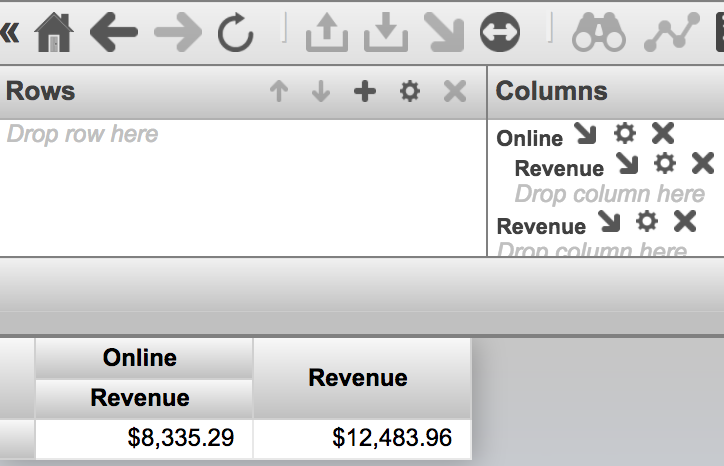
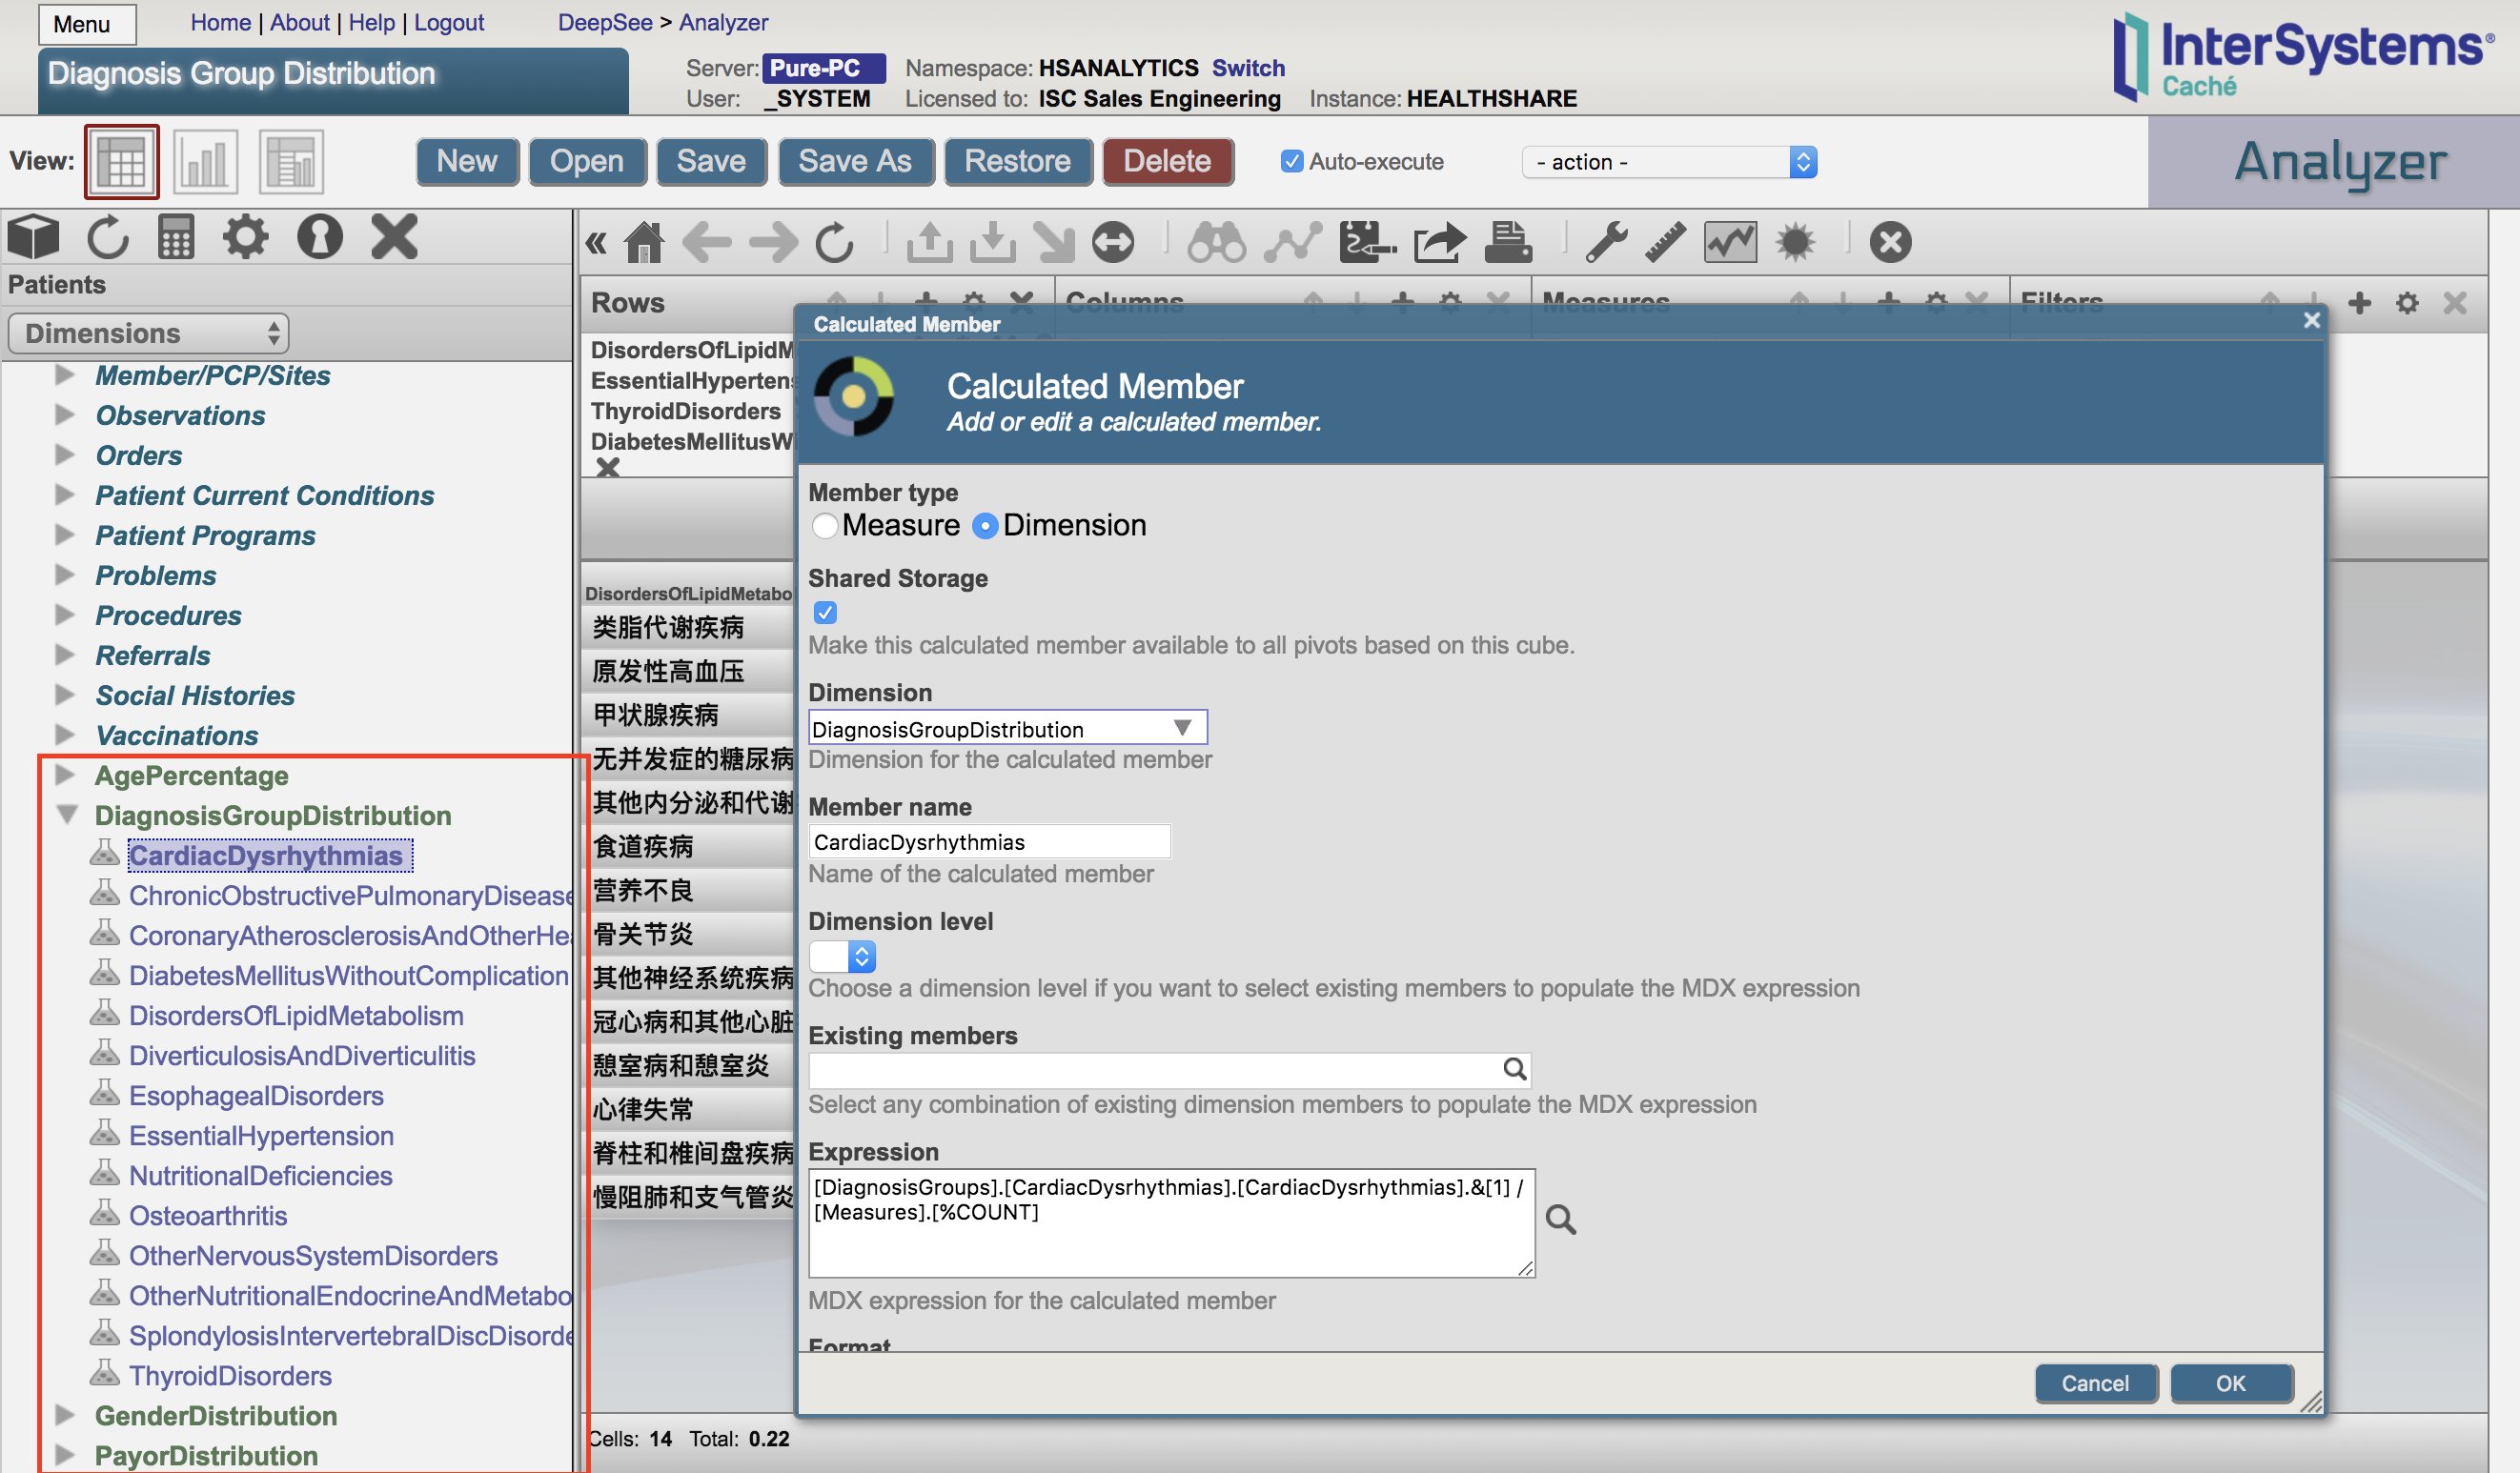
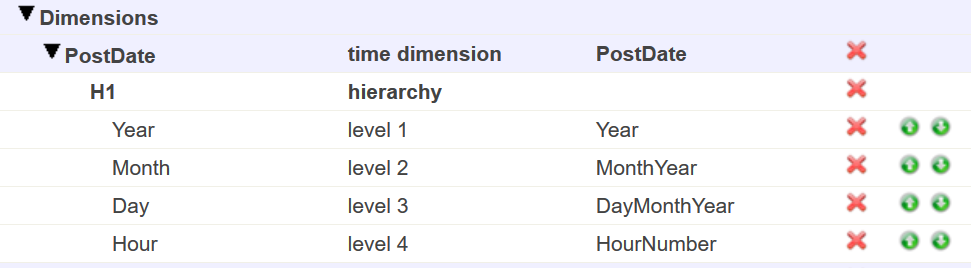
Hi all,
I am trying to understand how to work with Analytics but I get the message "Analytics is not enabled in the USER namespace"
.png)
How can I enable that for my namespace?
I am currently using iris-community:2023.1.0.185.0.
Thanks in advance!
This tag relates to the discussions on the development of analytics and business intelligence solutions, visualization, KPI and other business metrics management.
Hi all,
I am trying to understand how to work with Analytics but I get the message "Analytics is not enabled in the USER namespace"
.png)
How can I enable that for my namespace?
I am currently using iris-community:2023.1.0.185.0.
Thanks in advance!
Hi guys,
Does rebuilding of Data Quality Manager cubes affect patient index linkage definition data?
What I want to understand is, does DQM have any negative impact on the data each time you rebuild the cubes.
Additionally, if I make changes to the cube and rebuild it..will this have any impact on the original data?
I am receiving Mirroring updates to an IRIS for Health async reporting server and need to pause the mirroring journal processing to periodically quiesce the database to rebuild cubes and custom staging tables.
What API or web service can I use to quiesce the reporting server and then later initiate catch up?
Hi All,
I'm looking to write a 3rd party front end for BI cubes and have been directed towards the REST API here: https://docs.intersystems.com/iris20222/csp/docbook/DocBook.UI.Page.cls…
I've had quick test using postman and can use those fine, the issue I have is that there are some areas of metadata not exposed by the api that are essential to write a front end tool. I can list the cubes and measures using the /INFO/ paths, but that seems to be the limit of what is available.
Hi All,
I have a method like this and I want to be able to see the results on the terminal, how do I run this method on a terminal to display the results of this SQL query?
{
set oldNamespace = $Namespace
new $Namespace
set $Namespace = namespace
s timeTaken = 0, InDate = ""
#SQLCompile Select=Display
&SQL(select InDate, AVG(Time_Taken) into :InDate, :timeTaken from (select SessionId, (TimeCreated) InDate, MIN(TimeCreated) Start_Time,MAX(TimeProcessed) End_Time, DATEDIFF('ms',MIN(TimeCreated),MAX(TimeProcessed)) Time_Taken FROM Ens.
we have this container code where we want to create more CalcMember properties
So we need some syntax help how to use INLIST, NOTINLIST and CASE expressions. Anyone can help what should be the syntax for Expression to handle below 3 situations.
Hi,
I have 3 simple tables: Encounter, Patient and Immunizations. Encounter makes a reference to Patient, and Patient contains a list of Immunization objects.
I've tried using PowerBI to access IRIS (using ODBC connector, not InterSystems BI connector), PowerBI reports the error:
Expression.Error: The column 'Patient' of the table wasn't found.
Details:
Patientit does this for two of the three tables I need only (Patient and Encounter), but not for Immunization IRIS table..
Anyone know why and how to fix ?
Thanks - Steve
Hello all,
I'm trying to build a cube based on a linked table but seems that IRIS is not able to do it :O
Long story short, I have a linked table in IRIS that sources a Microsoft SQL table (using standard linked feature from the portal). It works fine, I can access it using SQL as many other times. On top of that, I've created in DeepSee (ok, Analytics) a cube that uses this class as source. It compiles correctly, no errors given. When I build it with 100 records, all goes well and using Analyzer I can see results.
Existing cube deleted.
Hello everyone,
I am working with InterSystems IRIS and seeking guidance on how to perform specific tasks related to the FHIR SQL Builder using commands or code, rather than the graphical user interface (GUI). The specific tasks I am trying to accomplish are:
Hello community, I need to solve a complex but trivial issue.
Given:
Two tables "Comment" and "Post". Each one contains an "Author" field, which is essentially a user ID. In these tables, each user ID represents an author. The goal is to count all participants together and then group them by month, language, and other metrics.
The question is how to do this within the IRIS ecosystem. Is it even possible to take two tables, get distinct data from them and then combine into one cube?
does anyone have an example of using %DeepSee.Utils:%GetDimensionMembers where you want to apply certain filters
For example I have a date dimension that I want to get all of the months level but filtering for only a specific year.
Thanks
I use $SELECT() in Architect to aggregate various data conditions into a single dimension.
I have a data table like this: id, user, userData1, userData2...
Where each user action is the %Integer ID of that action from some source. Then in expression field i use: $SELECT(userAction1:"This user action", userAction2:"That user action".) and so on, up to 14 conditions, excluding the default placeholder 1:"Other" (which is always empty because there is a condition with 100% chance).
I work a lot with IRIS BI, but some features are still a mystery to me. There is a great feature here that allows you to create expressions in Architect.
I'm already very familiar with it, but I still don't quite understand what environment it uses.
It can execute system classes like $SYSTEM.SQL, $PIECE(), %cube, %source(), it can do string concatenation, call methods from another classes.
I have two questions actually.
What environment it uses to execute this? Is it ObjectScript, SQL, MDX or maybe even its own?
Hi, I'm new to the Analytics world in Intersystems and was attempting to print and/or export selected rows from a detail listing in a pivot on a dashboard. I am able to print and/or export all the rows; but if I select a specific set of rows, it prints out the entire detail listing; not the selected rows. Please advise on the best approach to accomplish this task. Thanks.
Hence the question: is there a way to do that?
The goal is to get data (from half a thousand to 3-4 thousands lines) from DB, calculate standart deviation then use it as logical condition in analyzer.
For example IF std > custom_value = show_the_result ELSE null
There is a STDDEV(MDX) method used in Analyzer but it is a measure and it can not be used as logical condition (correct me if i am wrong)
And there is a Embedded Python with numpy, but logic behind STDDEV(MDX) and numpy.
Hi community
I have a persistent data class where there are some properties that contain underscores in their names, for example:
In Architect, I would like to use this property in an expression, in this field:.png)
But I can't figure it out. If I use %source.client_name, it gives a compilation error. If I use %source."client_name", it treats it as the string "client_name" instead of getting the value from the field. Any suggestions on how to do this?
Hi!
I have question about MDX functionality in context of IRIS Analytics.
How does IRIS MDX distinct selection works? Is there any restruqtion when analyzing strings? Like special symbols or length?
Here is an example
I have this data:
6 rows and 2 of them unique
Then we create data cube based on this model and examine it with Analyzer
Detailed listing
6 rows an ONE unique string. Which is obviously not true.
This happed only with string with symbols in it
My task is to get the right amount of unique strings
Hi everyone,
I am trying to create a treeMapChart in IRIS BI that will then be displayed on my DeepSeeWeb dashboard. In the IRIS BI User Portal, this is an example of what my treeMapChart looks like:
.png)
I know there is a huge amount of rectangles in this graphic - I care most about the common components (the largest boxes) but I still want all of the boxes to show. However, it projects to my DeepSeeWeb dashboard as the following:
.png)
The labels do not show, even if I hover over the boxes.
Hello everyone! 👋
I have a question regarding roles and resources.
To give you some context: I have a user who has been assigned only the role %HS_UsageDashboard_Access.This allows them to access the dashboards correctly (by giving the direct URL). Then, if I try to access the Management Portal with this same user, I can log in with no access to any resources within it (as expected).
The point is that I would like to completely deny him access to the Management Portal, while allowing him to view only the dashboards, as expected from the %HS_UsageDashboard_Access role.
I have a widget that uses "choose Data source" control option. Termlist for the control consist of the two data sources and i want to set one of them by default. For example: I have two data sources, one is grouped by month, the other by year. I need to set the one that is grouped by year by default
Using default value at the bottom return an error
How can i achive that?
Hi community.
I have a query:
SELECT
nameField,
dateField,
anotherDateField
FROM
(
SELECT
MIN(someDate) as dateField,
nameField,
anotherDateField
FROM $$$SOURCE
WHERE $$$RESTRICT
GROUP by someOtherField
)
WHERE dateField >= anotherDateFieldThis query should filter the data by the minimum value of the somDate field, but it doesn't. It displays all values together, regardless of the external filter. The exact same query (without the $$$ tokens, of course) works fine in a regular SQL runtime.
My guess is that the $$$RESTRICT does this
WHERE source.Can someone give me an explanation of how Local.PD.Linkage.Definition.Individual works? This was setup by another company as part of our implementation.
Below is my configuration..
.png)
We are getting a lot of matches on Given Name, but then the Family Name does not match at all, so I am wondering if these need to be adjusted. I just don't understand if they need to be positive or negative.
if I use the MLE CALIBRATION MONITOR, it seems that none of the values should be negative.
.png)
Hi everyone, on HealthShare Unified Care Record 2024.1.0 Build, we're using the Analytics section to create a dashboard containing a time chart showing a cumulative curve of the number of documents indexed in the registry for each documentSource of each repository. We tried the following steps: we created a cube whose dimensions are the CreationDate, SourceValue, and repositoryUniqueID of the HS_Registry.Document table; in the Analytics section, we created a pivot table that lists the document creation date on each row, along with as many columns as each repository's documentSources.
New to using Analytics and using Dashboards. We have this Report, SQL Query that lists out the Activity per Data Source in Health Share Provider Directory. Instead of running it as a report, because it takes a while to run, was wondering if there is a way to do this as a Dashboard instead.
.png)
How can I take the SQL from this report and create a Dashboard instead?