Some Usage cases

1. A deployment may consist of two high availability instances and two disaster recovery instances in a different data center.

The corresponding UAT environment could replicate this giving a total of 8 instances. How do you confirm CPF and Scheduled task alignment across ALL instances.

3 2
0 449

So if you are following from the previous post or dropping in now, let's segway to the world of eBPF applications and take a look at Parca, which builds on our brief investigation of performance bottlenecks using eBPF, but puts a killer app on top of your cluster to monitor all your iris workloads, continually, cluster wide!

Continous Profiling with Parca, IRIS Workloads Cluster Wide

3 0
2 234
Article
· Feb 3, 2023 3m read
Queue monitoring

Overview

With the gradual improvement of hospital information construction, there are more and more business interfaces in hospitals. Due to the influence of various factors (network, consumer system, etc.), the data processing of business interface may cause excessive message accumulation and even the situation of interface card congestion, which affects the normal business development in the hospital. Therefore, the monitoring of the queue of business interface components becomes more and more important.

3 2
0 495
Question
· Oct 20, 2016
%UnitTest Code Coverage

Hi,

When we write unit test cases for cache object script code using %UnitTest.TestCase, what is the best way to write code to identify code coverage?

So, let say my unit test case hit all 10 lines of code of a method for a given class. So, unit test coverage should be 100% for that. But, using line-by-line coverage [(%Monitor.System.LineByLine] getting wrong percentage, because it also includes code comment/documentation as part of code. So, practically we can not ever achieve 100% of code coverage by using this API.

2 2
0 868
Announcement
· May 15, 2024
iris-medicopilot video announcement

Hello developers,

Our project was designed to optimize patient clinical outcomes by reducing hospitalization time and supporting the development of resident and novice physicians. Additionally, it contributes to lowering financial waste in the healthcare system by improving the monitoring of pregnant patients, thereby decreasing risks and enhancing their safety.

Using the most accessible tool, the smartphone, was the obvious choice to make patients' lives easier.

https://www.youtube.com/embed/OL3kdE-JL4c?si=HV6kopsNGJLCVSdl
[This is an embedded link, but you cannot view embedded content directly on the site because you have declined the cookies necessary to access it. To view embedded content, you would need to accept all cookies in your Cookies Settings]

2 2
0 165

The MONITOR process (also called the Caché Monitor) scans the messages in your cconsole.log file and sends you emails based on the severity of those messages. The MONITOR is configured using the ^MONMGR utility in terminal.

The MONITOR should not be confused with the similarly named System Monitor, which checks a variety of system health and performance metrics and can log messages regarding them to the cconsole.log, where they can then be scanned by the MONITOR.

2 6
2 1.4K

Hi all,

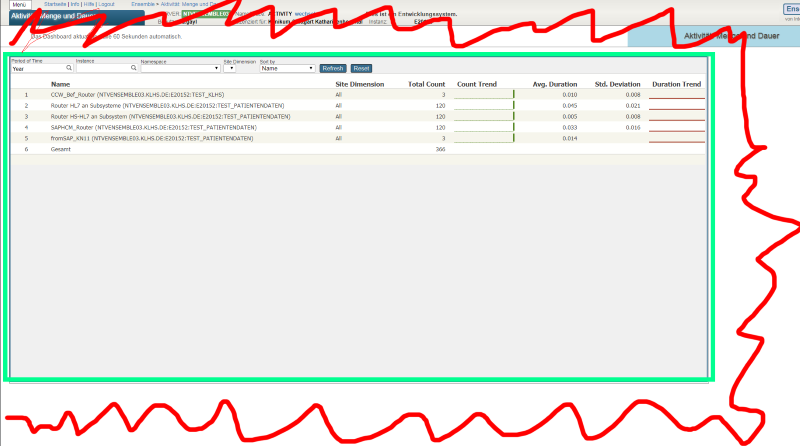
I recently discovered the Monitoring Activity Volume feature in IRIS and I was amazed by it. So, I put it to work in one of our productions. It is nice how easy it is to set up and all the possibilites that came with it.

But there's something weird: the numbers. Actually, one of the BP is stating a time of more than 6 seconds to process:

2 6
1 386

Hi Community!

Please find the Developer Community video of the week:

Monitoring : Don't Turn a Drama into a Crisis

https://www.youtube.com/embed/T_RK5QzRZ0Q
[This is an embedded link, but you cannot view embedded content directly on the site because you have declined the cookies necessary to access it. To view embedded content, you would need to accept all cookies in your Cookies Settings]

2 0
0 321

Please excuse my ignorance. I am trying to identify what areas would be best to review in the System Dashboard (for Cache 2010.2) for performance issues with the database. It seems to be running slower than usual, but I am trying to find out the best way to go about identifying what the issue is.

The following are captures from the System Dashboard.

As always, thanks a lot for your help.

System Dashboard

2 3
0 591

Hi Developers,

Join us at the upcoming Developer Roundtable on April 25th at 9 am ET | 3 pm CET. 📍
We will have 2 topics covered by the invited experts and open discussion as always.

Tech Talks:
Practical Usage of Embedded Python - by Stefan Wittmann Product Manager, InterSystems

Recording:

https://www.youtube.com/embed/a6VH4Hg5TmI
[This is an embedded link, but you cannot view embedded content directly on the site because you have declined the cookies necessary to access it. To view embedded content, you would need to accept all cookies in your Cookies Settings]

1 1
0 187

Hello, good morning, thank you so much for reading this question. ☺️🙂👍

We are developing a code to get information about our Production's items: services, processes and operations.

We know we can get various configurations of a given item: Category, Port, Enabled...

But we wonder how we could get the date time of the last mesage (most recent) received in an item.

To give a code snippet a small section of the code we have developed (and tested), it looks like:

1 2
0 43

Can Cache Monitor (^MONMGR) and System Monitor be configured to also send 'OK' messages? With the first bad email, you still wonder if things are still broken, when in-fact normalcy has been restored, some even within some seconds.

typical examples : -

------ - - - -- - - - -- - -- --- - -- -- -- - - - -- -- -- - --- - - - -- - - -- - - -- --- - - -- -- -- - - --- - - - - --- -- --- - - -- -- --- - - --- - --- -- - - -- -

Sent: Monday, 14 November 2016 11:51 AM

To: Email

1 1
1 1.7K

I need to develop a tool to help to get what data is being consumed by a certain process, in order to get all data used to build an automated test scenario.

For example, some user process will pull data from ^GLOBAL(1)="dataString", ^GLOBAL(2)="dataString2", ^GLOBAL1(1)="data1String", ^GLOBAL2(4)="data2String4". Amidst all other data on these Globals, I will ignore everything that was not used in the user process, and get the specific keys used on it.

1 12
0 451

We are running HealthShare on Linux Redhat via Azure.

A couple of days ago, the Azure server rebooted. Which we were unaware of.

Resulting in the Instance being in a downed status.

In the short term I put together a quick script to check the status, if it is down to restart it.

However, before I go down that road, I thought it would be best to inquire if there is a much better and more streamlined solution?

In a nutshell I just want to check and see if the Instance is up or in a state such as down or hung then start it.

1 2
0 513
Discussion
· Nov 28, 2023
Monitoring Platforms

With System Alerting and Monitoring (SAM) being deprecated in the near future..

  • What is everyone's go-to for Monitoring IRIS?
  • What is readily available?
  • What is the cost surrounding it?

Just trying to get ideas floating around of what we might need to start looking at to satisfy IT leadership.

Thanks

Scott

1 10
0 472

Hi Community!

The new video from Global Summit 2019 is already on InterSystems Developers YouTube:

System Alerting and Monitoring Made Easy

https://www.youtube.com/embed/XtXzvN3Gqgw
[This is an embedded link, but you cannot view embedded content directly on the site because you have declined the cookies necessary to access it. To view embedded content, you would need to accept all cookies in your Cookies Settings]

1 0
0 334