InterSystems Business Intelligence enables you to embed business intelligence (BI) into your applications so that your users can ask and answer sophisticated questions of their data. Specifically, your application can include dashboards, which can include the following:
Interactive widgets that execute queries designed for specific user roles or for specific areas of your user interface.
Controls such as drop-down lists and data choosers that enable users to modify these queries.
Interactive drill options that enable users to view the displayed data in different ways.
Options to export, print, and send alerts to other users.
An option to launch the Mini Analyzer, which supports free-form analysis.
Execute custom actions that are provided as buttons or other controls.
In contrast to traditional BI systems that use static data warehouses, Business Intelligence is kept closely in synchronization with the live transactional data, as required for your business.
I'm trying to get my Combo Chart to dynamically scale the Y axis, but it's not doing what I would like. The 1st Y series, if the MAX value is set to null, scales the chart and the series fine, but then the subsequent Y axis are not to that same scale. Each "null" Max'ed series is setting it's own scale based only on it's own ranges and not in sync with anything else.
Is there a way to force all of the "null" scaled columns to be in the SAME scale as each other AND be dynamic.
How do we return a member from a set? For example if I want a calculated measure to return the NAME of the date with the max transactions, to get the set ordered I might do something like:
But how do I access the first member in the set as a member so that I can get to the properties such as the member NAME (what I want to return in this case)?
In some MDX implementations like Microsoft there are kind of backdoor functions for this like:
When creating a filter located on a dashboard that targets all, is there a way to narrow that filter down?
For example, in our data we have some dates that are well out of range due to data quality issues, but they still appear in the drop downs. Is there a way to say, only make available the below dates in the filter?
Another example, If we want to only look at Emergency data, it still provides all the wards for inpatient activity and activity in other hospitals, meaning, to get to just the Emergency wards you have to scroll through everything?
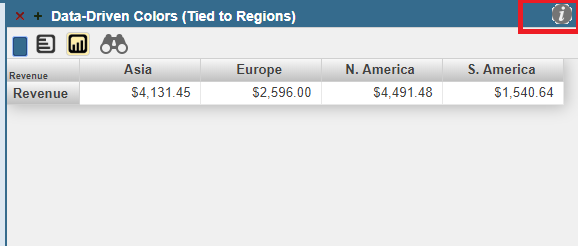
I want to include Info icon on DeepSee-Widget title bar like the image below. And when I click or hover on the icon it should display some information about the widget. I tried with the options available in Widget settings and referred InterSystems's documention as well, I couldn't find a way to get this.
Please help me to achieve this. Thanks in advance.
In addition to charts on a dashboard we have a request to have a crosstab which would be populated by some entries queried out of an error log. It's basically a detail query with mostly text data. I have tried making a pivot widget for this using both a cube and kpi source, and while succeeding with the KPI, it leaves a lot to be desired.
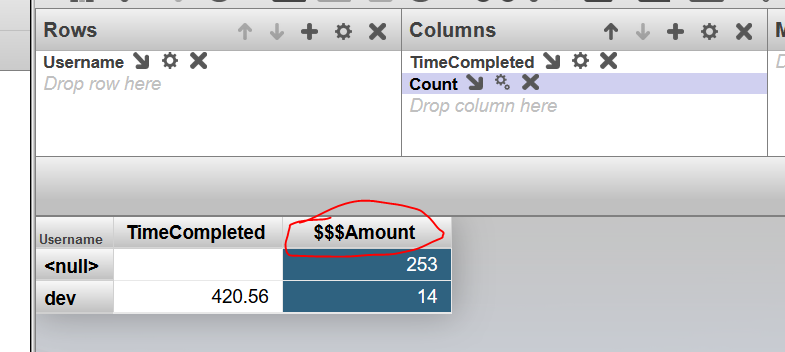
I am building a pivot table and need help creating a calculated field for a dollar range. For instance, I am trying to create a calculated field to show account balance greater than $5k and less than $10k.
When I export the cube and the pivots that I made and import to another environment , the calculated metrics and dimension and also de pivot variable didn´t appear in the other environment. Because of this the pivot that use these metrics show error when you try to open.
I want to know that this behavior is normal or exist a way that you can export everything, independent if you build inside the cube or inside analyzer.
The question that I have , it's very simple. I developed a pivot that contains two rows, the first it's a date and the other another field. I need to orde by date in descending order and I can´t find where I can do this. I saw that it's a option Sort members, but it's based in a condition of the measures.
I have created user with access to a profile with all the %Deep_See options (%DeepSee_Admin, %DeepSee_Analyzer etc etc) as well as %All. I have also added %All to unknownuser
When click the DeepSee page and choose a namespace Architect, Analyzer, Reporting Data Definition and Reporting Builder are all greyed out with 'you do not have privilege to view this page
I am moving some DeepSee components to another environment and would like to know if the pivots and dashboards have to reside in the "Other" branch of the Workspace in Studio.
Following instructions on this page https://docs.intersystems.com/latest/csp/docbook/Doc.View.cls?KEY=D2IMP_... I am trying to create a Data Connector to be used as a base class for a cube with update support. That page suggests that putting an SQL query inside XData block is not suitable for a Data Connector that supports updates. Later it also suggests that to enable updates your SQL query must include
When requesting /MDX2JSON/PivotVariables/Patients?Namespace Patients shoud be passed to a method but its not. When argument passed directly into the method it works.
According to the documentation (2016.1) we can use either a system defined web application (/api/deepsee) or create a custom web application for handling requests. What are some reasons to use one rather than the other?
Is there a way to add a scroll bar to a widget on a dashboard. I want to shorten the width of my bar graph widget but it causes the bar graph to be scrunch together. Also, is there a way to expand the width between each bar on the graph?
How to setup dollar ranges to get the number of patient accounts. So, I want to capture the number of patient accounts based on the original balance of:
0 to 499
500 to 999
1000 to 2499
5000 to 9999
10000 to 24999
25000 to 49999
50000 to 74000
75000 to 99999
 By likes