Hi guys.

Recently, I get interest in FHIR in order to run for the IRIS for Health FHIR
contest
. As a beginner on this topic, I've heard somewhat about it, but I didn't know how complex and powerful was FHIR. As pointed out by @Henrique.GonçalvesDias here, you can model several aspects of the patient history and other related entities.

4 5
0 294
Article
· Aug 2, 2020 1m read
Application Errors Analytics

Hi Developers!

As you know the application errors live in ^ERRORS global. They appear there if you call:

d e.Log() 

in a Catch section of Try-Catch.

With @Robert Cemper's approach, you can now use SQL to examine it.

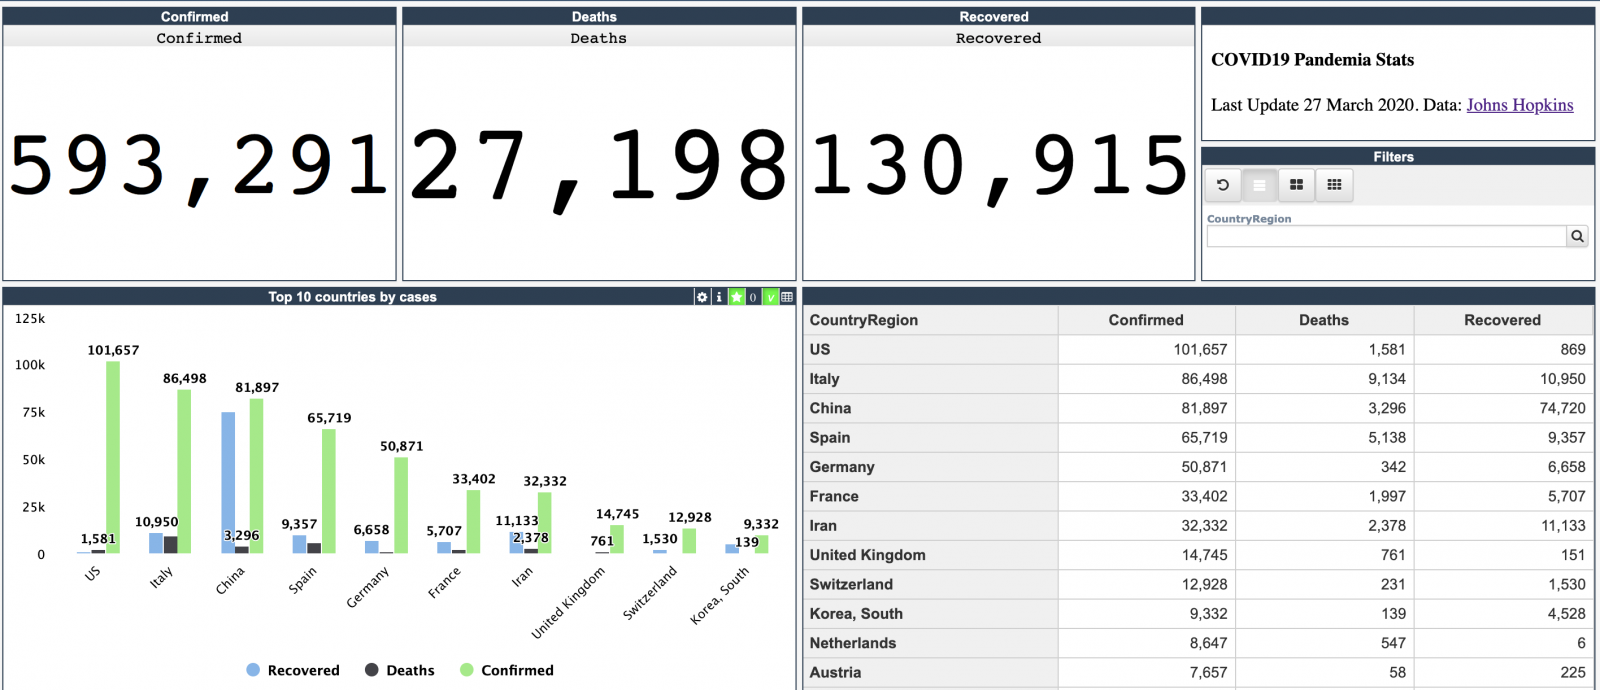
Inspired by Robert's module I introduced a simple IRIS Analytics module which shows these errors in a dashboard:

3 5
1 297

Now available on Open Exchange is a library of third party charts available to use within DeepSee/InterSystems IRIS BI dashboards. To start, simply download and install, select the new portlet as the widget type, then select the chart type that you desire. If you don't find the type of chart you are looking for, you can easily extend the portlet to implement your desired chart type. These new chart types can be used within existing dashboards or you can create new dashboards using them.

4 0
0 883

Hi Devs!

Last weekend I had been testing the newborn csvgen module and was looking for a CSV file to test - thus I came across an interesting datafile on Data.World with Game of Throne episodes statistics. Death statistics. These folks documented all the murders through all the 8 seasons and noted where, who, from what clan with what weapon had killed another one.

So I imported it and made an IRIS Analytics dashboard.

You Know Nothing, Jon Snow | You Know Nothing, Jon Snow | Know ...

Don't worry, Jon, with this dashboard we can figure out something ). See the details below.

6 0
2 566

Hi colleagues!

Every day Johns Hopkins University publishes new data on coronavirus COVID-19 pandemic status.

I built a simple InterSystems IRIS Analytics dashboard using InterSystems IRIS Community Edition in docker deployed on GCP Kubernetes which shows key measures of the disease outbreak.

This dashboard is an example of how information from CSV could be analyzed with IRIS Analytics and deployed to GCP Kubernetes in a form of InterSystems IRIS Community Edition.

Added the interactive map of the USA:

19 13
3 945

InterSystems IRIS Business Intelligence allows you to keep your cubes up to date in multiple ways. This article will cover building vs synchronizing. There are also ways to manually keep cubes up to date, but these are very special cases and almost always cubes are kept current by building or synchronizing.

2 1
0 552
Article
· Mar 2, 2020 2m read
SQL -99 error while viewing a listing

This error is sometimes seen while viewing a listing in InterSystems IRIS Business Intelligence:
ERROR #5540: SQLCODE: -99 Message: User <USERNAME> is not privileged for the operation (4)

As the error suggests, this is due to a permission error. To figure out which permissions are missing/needed, we can take a look at the SQL query that is generated. We will use a query from SAMPLES as an example.

1 0
0 799

Preview Mode was added to InterSystems IRIS Business Intelligence to give designers a quick view of what their resulting Pivot Table will look like without needing to wait for the results to fully execute. This can be beneficial when designing pivot tables because if you are dragging and dropping elements to see how they look/work in your pivot table and seeing if they have the desired data. Since you are exploring and designing, you don't necessarily care about the results at the moment, but you would still like to see how your table looks with the changes you have made.

2 0
0 358

Hi Developers!

Many of you are looking for samples on how to work with InterSystems IRIS Analytics, formerly known as DeepSee.

There is a Samples BI module with Patients and Holefoods examples which is available on Github with source code. The installation steps are clear but take time.

Recently we added the option to run IRIS Community Edition containers with ObjectScript Package Manager (ZPM) on board. This simplifies the installation to the "run-one-command" step for the modules submitted to ZPM Community Registry. And thus we can benefit the Samples BI installation with ZPM.

And here is how you can run it on your laptop. Let's go!

1 1
0 340

In the previous part of this series, we saw how to include data in a portlet from within DeepSee. This used the built in data controller. In this part, we are going to be pulling in data from outside of DeepSee. This will include both information from within InterSystems IRIS and from the OS.

Why use this?

This is useful if you would like to create a dashboard that only contains information about your system. It is also useful if you want to display data about your system along side data that you have stored in DeepSee.

2 0
0 315

When using Related Cubes in InterSystems IRIS BI, cubes must be built in the proper order. The One side must be built before the Many side. This is because during build time for the Many side, it looks up the record on the One side and creates a link. If the referenced record is not found on the One side, a Missing Relationship build error is generated. The One side is going to be the independent side of the relationship, AKA the side of the relationship that is referenced by the Many side or the Dependent cube. For example: Patients contain a reference to their Doctor.

3 0
0 461

What is %SQLRESTRICT

%SQLRESTRICT is a special %FILTER clause for use in MDX queries in InterSystems IRIS Business Intelligence. Since this function begins with %, it means this is a special MDX extension created by InterSystems. It allows users to insert an SQL statement that will be used to restrict the returned records in the MDX Result Set. This SQL statement must return a set of Source Record IDs to limit the results by. Please see the documentation for more information.

Why is this useful?

This is useful because there are often times users want to restrict the results in their MDX Result Set based on information that is not in their cubes. It may be the case that this information may not make sense to be in the cube. Other times this can be useful when there is a large set of values you want to restrict. As mentioned before, this is not a standard MDX function, it was created by InterSystems to handle cases were queries were not performing well or cases that were not easily solved by existing functions.

6 0
1 544
Article
· Dec 31, 2019 3m read
Portlets that use data from DeepSee


In the previous part of this series, we saw how to reference a web page that will enhance our dashboard experience. Now we will look into referencing data that is already in our cubes.

In this example, we will be referencing the controller object and we will be extracting data from it. This data will then be displayed as text in our Dashboard. In Part 5, we will show how to incorporate this data into other charting libraries.

2 0
0 215

In the previous part of this series, we saw how to define a basic portlet. Now we will look into making this portlet reference a web page that will enhance our dashboard experience.

In this example, we will be embedding a Developer Community article along side a couple of widgets displaying information related to the number of views on the Developer Community articles. This example is not hosted on the Community Analytics server, but if it was we could see the view counts going up as we interacted with the page.

Why use this?

In a real case, perhaps you have an embedded page from an external web site showing the current Emergency Room wait times for Hospitals in your area. This portlet can be used along side widgets from your Emergency Room showing how many people are waiting, how many doctors are active, and how many people are being treated. As other Emergency Room wait times grow, you can possibly expect your volume to increase as well. This can help you make decisions on how to allocate resources.

1 0
0 373
Article
· Dec 12, 2019 2m read
Creating Portlets in DeepSee

What is a portlet?

The simple answer is: a custom widget. A portlet can exist by itself on a DeepSee dashboard, it can be used along side standard DeepSee widgets, or along side other portlets. The rendering of the custom widget is completely user defined. This means you can embed a web page, create a form to perform any sort of action needed based on the data on your dashboard, use third party charting libraries, or simply display data from outside of a DeepSee cube.

How to get started

6 1
0 440
Article
· Nov 26, 2019 3m read
Designing valid hierarchies in DeepSee

When designing a hierarchy in DeepSee, a child member must have only one parent member. In the case where a child corresponds to two parents, the results can become unreliable. In the case where two similar members exist, their keys must be changed so that they are unique. We will take a look at two examples to see when this happens and how to prevent it.

5 1
0 675

Why log in to view pivot tables when you can have them delivered directly to your inbox? Are you in need of automated reporting for InterSystems IRIS Business Intelligence? Pivot Subscriptions is your solution: a tool for subscribing to scheduled email reports of pivot tables inside InterSystems IRIS Business Intelligence (previously known as DeepSee).

6 0
1 482

AnalyzeThis is a tool for getting a personalized preview of your own data inside of InterSystems BI. This allows you to get first hand experience with InterSystems BI and understand the power and value it can bring to your organization. In addition to getting a personalized preview of InterSystems BI through an import of a CSV file with your data, Classes and SQL Queries are now supported as Data Sources in v1.1.0!

6 4
0 560

Users of analytical applications often need to generate and send out PDF reports comprised of elements of the analytical panel. In the InterSystems stack, this task is solved using the DSW Reports project that is an extension of DeepSeeWeb. In this article, we will explain how to use DSW Reports for generating PDF reports and emailing them.

1 0
1 507

Introduction

Any election is a highly mysterious process, and when you look at its results, the overall picture is not quite clear. I decided to put them, region by region, on the map of Moscow using InterSystems technologies that offer both storage and data analysis functionality. In this particular case, I used InterSystems Ensemble, a platform for application development and integration, but you can also build this solution using the multi-model InterSystems Caché DBMS, as well as InterSystems’ new product called IRIS Data Platform.

3 0
0 705

The source class of a DeepSee cube has a property referencing a different class:

Class ClassA Extends %Persistent {
     Property P1 As ClassB;
}

When records in class B change, the ^OBJ.DSTIME global for Class A will not be automatically updated. This means that synchronization of cubes based on source class A will not reflect the changes occurred to property P1.
This post will help you determine the best way to achieve synchronization of properties referencing a different class

4 2
2 428

I was approached recently by and end use who wanted to perform analysis of their databases and see how they could save some space by picking data good for deletion without harming the application. As part of investigation, they wanted to know sizes of globals within datasets. This can be achieved by various means but all of them provide data in text form only.

I thought I might be a good tool for database administrators in general - to see global sizes in a graphical way.

2 1
0 346

The following post outlines a more flexible architectural design for DeepSee. As in the previous example, this implementation includes separate databases for storing the DeepSee cache, DeepSee implementation and settings, and synchronization globals. This example introduces one new databases to store the DeepSee indices. We will redefine the global mappings so that the DeepSee indices are not mapped together with the fact and dimension tables.

2 1
0 543

The following post outlines an architectural design of intermediate complexity for DeepSee. As in the previous example, this implementation includes separate databases for storing the DeepSee cache, DeepSee implementation and settings. This post introduces two new databases: the first to store the globals needed for synchronization, the second to store fact tables and indices.

5 5
0 683