Question
· Aug 13, 2019
Dashboard - Line Graph

Hello,

I want to create a dashboard with a line graph that shows system availability over time. I used this code to create a Dashboard:

            Set tItem = ##class(%DeepSee.UserLibrary.Link).%New()
                Set tItem.fullName = "Availability"
                Set tPage = "Availability.UI.CSVImport.zen"
                Set tItem.href = $system.CSP.GetPortalApp($namespace,tPage)_tPage
                Set tItem.title = "Availability"
                Set tSC = tItem.%Save()
0 7
0 359

Hello,

I am still trying to figure that Calculated Measure stuff and I hope to learn from you. I have several cubes I am trying to create calculated measures using the Calculated Member Expression.

I have a cube called Cards. There is a measure called count that give total cards count of 15,000. There are two dimensions I am considering. One is the CreditGrade (A, B, C, D, nograde) and the other is the date of the scoredate.(2000-2015).

The CreditGrade dimension has two hierarchies. H1 being the creditnumber and H2 being the CreditGrade (The one I need).

0 2
0 191

Hi Community,

I have below scenario

We have IRIS BI Reports in my application. I want to create a automated backend utility (similar to background cache system task) which run these bi reports and export them to PDF at a specific path. In dashboard we have defined <property name="print">1</property> which allows report export to PDF.

Now I want to debug the code (line by line) from dashboard to %DeepSee.UI.MDXPDF.cls but I am not sure is this possible or not.

Please suggest. Thanks in advance!

0 1
0 142

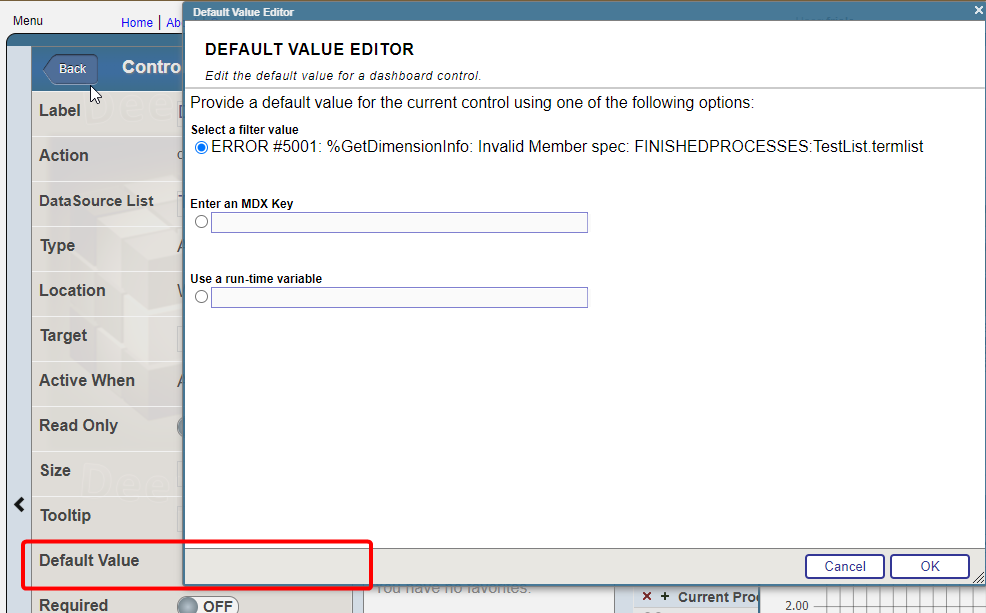
I have a widget that uses "choose Data source" control option. Termlist for the control consist of the two data sources and i want to set one of them by default. For example: I have two data sources, one is grouped by month, the other by year. I need to set the one that is grouped by year by default

Using default value at the bottom return an error

How can i achive that?

0 2
0 37

Presenter: Joe Gallant
Task: Create a good analytical data model
Approach: Discuss what makes a good analytical data model. Provide examples of using DeepSee’s APIs for building custom dimensions, measures, and KPIs

Data models are the foundation of effective analytics. This session focuses on the factors that make good analytics data models.

Content related to this session, including slides, video and additional learning content can be found here.

0 1
0 263

My group needs to be able to monitor items / tasks, and let a non-management-portal user see the monitoring. Is it possible to run DeepSee queries on Production items? I feel like I should not be recreating the production environment or the task manager just so that I can query on the items that are running, and on their states (like "successful" or "send email").

Also, I need to log custom events for each task, and I'm running into difficulties with the task manager in this regard; hence the question about using the Production instead, but querying it.

0 1
0 353

When requesting /MDX2JSON/PivotVariables/Patients?Namespace Patients shoud be passed to a method but its not. When argument passed directly into the method it works.

<Route Url="/PivotVariables/:Cube" Method="GET" Call="WritePivotVariablesForCube"/>

Has something changed in IRIS and this syntax is deprecated, or is there a bug and the colon is ignored? What could it be?

This question is continuation from https://community.intersystems.com/node/534811

0 1
0 184
Question
· Nov 10, 2015
Dashboard Branding...

Hello DeepSee'ers -

How hard is it to brand a dashboard to a login?

The situation is, I have a Partner that is looking to create common Dashboards in a SaaS model where the Partner's Clients would want to have their individual views of this common dashbaord be branded (logos, color, styles, etc.) to match the Client's branding. This my Partner's Client's End Users will see this common dashboard as the dashboard from the "Client" and not the "Partner" (and certainly not ISC branding)

ie. ISC -> Partner -> Client -> End User

0 2
1 329

Presenter: Barry Cooper
Task: Enable users to perform analytics within an application and take actions based on those analytics
Approach: Provide examples of embedding DeepSee within applications

Analytics is more than just using data to provide insight. Analytics is about taking action on that insight. See examples of how you can embed DeepSee in your applications, allowing you to take action.

Content related to this session, including slides, video and additional learning content can be found here.

0 0
0 178

Hi.

I would like to know if DeepSee has some feature regarding synchronization which could help me with this:

I have two tables, TableA and TableB in a 1:n relationship, and one cube for each table, CubeA and CubeB.
CubeA have a list dimension based on records from TableB.
Both tables has DSTIME parameter set to "AUTO".

Some application proccess updates data only on TableB, leading an entry on ^OBJ.DSTIME global for synchronization of CubeB.
However, as the TableA wasn't updated, there isn't such entry for CubeA.

0 2
1 249

We have a rest service that collects production status information like whether a connection is disabled, enabled, etc.

I would like to present that data in a DeepSee dashboard but do not know how to create a pivot that accesses the data gathered by the service.

Does anyone have any information or documentation about how a dashboard would be configured to use use a Rest service?

Thank you

0 2
1 312

I'm looking for a means to dynamically specify and/or limit the data from the source that goes into a cube at build time.

I have a single data class that defines my source, and as the data within this table/collection grows/changes over time, I would like to be able to control which records actually make it into the indexed cube, but I'm having a hard time (short of defining a stored procedure to use instead of the extent query) for populating my cube indexes.

0 2
0 196

Hi -

I need an example of what I need to "map" to have a common dashboard defined so it will visible/usable in multiple namespaces.

I have created a dashboard in "SAMPLES" (namespace and database) and I would like to have this dashboard be accessable/useable from a 2nd namespace, but I'm not having any success in doing mappings (global/package/routine/data) to be able to get DeepSee to be able to see/display the dashboard.

What is the minimum that I need to map?

0 4
0 419
Question
· Feb 11, 2018
Deep see Learning

I tried to learn DEEP SEE Analytics for our HealthShare "SAMPLES" Name Space. I followed our documentation and tried it. But my management portal analyzer and visual reporting fields are hidden. So Please help me for how do I use the deep see concepts and provide some examples or demo.

Thanks ,

Ponnumani G.

0 1
0 238