 By views
How can I localize arbitrary column name in DeepSee pivot?
If a column name is a dimension or a measure I can localize using architect following this guide.
But what about some random string?
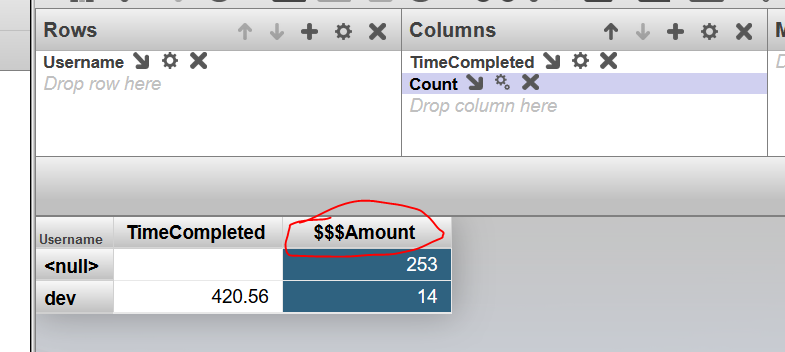
I have tried setting:
- Value
- $$$Value
- $$$Value/MYDOMAIN
as a Caption, but every option simply displays as is.
 Open Exchange app
.png)