Hi developers, 

Serenji 3.2.0, the latest version from George James Software, was released last week and our current users have been enjoying trying out the new features (which you can find more about here). 

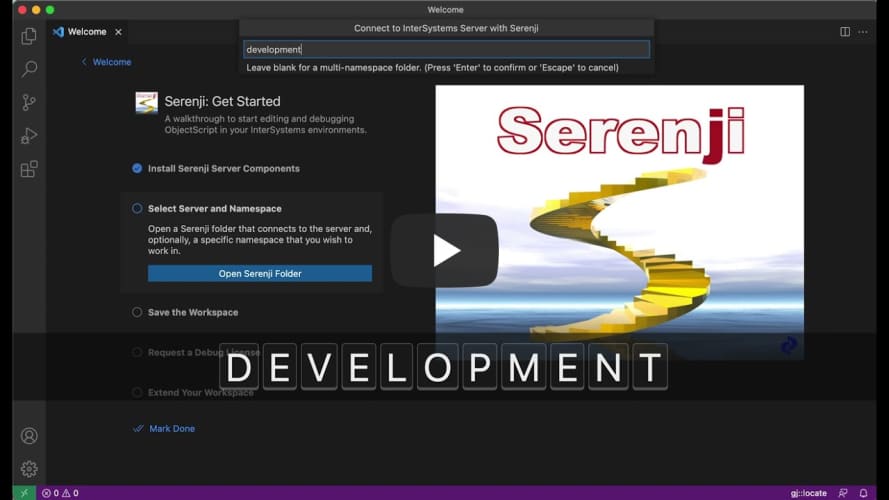
If you're thinking about trying Serenji for the first time, we've made it easier to get set up by adding a walkthrough on the VS Code Welcome page. It takes you through: 

  • Setting up the server components.
  • Selecting a server namespace.
  • Saving and extending your workspace.
  • Requesting a debug license (don't forget we offer a free 30 day trial!) 

We've also added prompts and guidance throughout VS Code to open and add Serenji folders to your workspace and when going to run and debug code. 

This is just one of the ways we've enhanced the Serenji debugger to make straightforward and easy to use - so all you need to do is focus on your code. 

Serenji 3.2.0 Welcome Page Walkthrough

1 0
0 171

Hi,

I have a HealthShare HealthConnect operation which uses the EnsLib.HTTP.OutboundAdapter. It is using a custom Operation class to send HTTP Post request. The request data that is sent to the operation and the response back from the operation is not displayed on the visual trace. Is there anyway to display this data in the trace?

Thank you for your help.

1 7
0 570

OAuth server to be deployed on the IRIS learning cloud platform. Clients - one on the other instance of the learning IRIS server, the other client locally on my computer in the container docker.

Both clients get a seemingly correct link (through ##class(%SYS.OAuth2.Authorization).GetAuthorizationCodeEndpoint()) to the login request form:

1 3
1 763

Hi all,

For custormer support reasons we would like to know if its possible to activate some kind of flag or see/redirect wich is the code (lines) being executed when some misterious problems appear.

Is there any way to view the stack of execution code on a deployed code environment? Is there any other equivalent way to track the execution stack for a certain period of time?

Best regards

1 5
0 385
Question
· Oct 17, 2023
Debugging a SOAP web-client

Pointers please for debugging a SOAP web-client.

We have several clients in different productions all accessing a web-service. We are trying to add another client in a new production, and its not working. The messages between the relevant Process and the SOAP web-client Operation are the same in the working and the non-working productions. But the web-service is reporting an XML parsing error to the non-working production. Here's the error as reported in the SOAP web-client Operation...

0 3
0 157

I am currently debugging a piece of code relying heavily on macros. I am using breaks in the method to then check the values of macros and object properties as I go. However, any time I invoke a macro within a break I get an error. To get around this I am converting the macro calls into the underlying code. Some of these macros have messy translations and this is somewhat time consuming. Is there an easier way to access macros from within a break?

0 5
0 156

Context

I have created a Business Operation (BO) named "Sender" that sends HTTP messages to an endpoint (for testing, I'm using Postman's Mock Servers).

Goal: I want to set up an automatic timeout mechanism so that if I don't receive a response from the server within 18 seconds, an alert is generated and the message is resent. This process should be repeated every 18 seconds, for a maximum of 90 seconds. If no response is received within 90 seconds, I would like to generate an error message. On the other hand, if a response is received, I want to stop the resending process and complete the operation by indicating successful reception.

0 7
0 240

Hi I am trying to run a debugger in VS Code. I have the settings.json file and the launch.json file. I am trying to debug code using the attach to a process method, however when I run the debugger I get the following error.

Launch.json code

{

// Use IntelliSense to learn about possible attributes.

// Hover to view descriptions of existing attributes.

0 1
0 211

Is CR/LF changes to DTL files edited/committed to git via VS Code a known issue?

We had an issue with exporting files from one server and importing on another, using XML code exported from Studio: ERROR #6301: SAX XML Parser Error. Turns out that issue was down to CR/LF changes made when transferring the XML from one server to the other.

0 2
0 146

Exported contents of a namespace on one server (classes, include files and lookup tables). Importing that code into a newly created namespace on another server. Both servers Ensemble 2018.1, same build. Export was via InterSystems Studio. Export is around 18Mb in total (XML file sizes).

When importing and compiling on the new server, getting errors as below - with #6301: SAX XML Parser error prominent - on a number of the imported files, all containing data transformations or business processes.

0 1
0 382
Question
· Apr 20, 2023
Uninstalling Ensemble

On a developer's laptop, having had two or three Ensemble installs with different settings/config changes made, and encountering unexplained errors compiling classes, wanting to scrub as much of the previous installs off the machine before doing any fresh installation... But can't find clear documentation on doing a complete uninstall!

Have stopped the server.

Am I safe to remove C:\InterSystems\Ensemble (for the instance installed into that folder)?

0 6
0 341

I've faced a problem that happens while debugging a process in VSCode. It doesn't seem to matter if this is in a container, on my development VM, or against a locally installed version of IRIS. The problem seems to be mostly with X12 Documents.

So, in a debug session, I can dump out a value to the debug console and it loos correct. The same variable in VSCode appears to be some uninitialized memory location.

In the interactive debugger window:

0 4
0 288

While I love using VSCode for IRIS development work, one of the persistent frustrations with it has been the inability to display an object hierarch in the variables window while debugging. Only the object's reference identifier is displayed. Cache Studio's handling of the same issue is a little clunky, but it does at least have the option to display something as an object.

For now, I make do with a combination of the watch window and the command line in the debugging console -- but this feels just a step away from log.debug()/console.log() level debugging sometimes.

0 2
0 329