The release of InterSystems IRIS 2021.1 introduces Adaptive Analytics. To get started with a familiar InterSystems IRIS BI sample cube, we have created a HoleFoods Sample Application for Adaptive Analytics. This Sample Application is available on Open Exchange. There is also a learning services course available to learn more about Adaptive Analytics.

3 0
0 239

Is there a way to add/substract from a pivot variable?

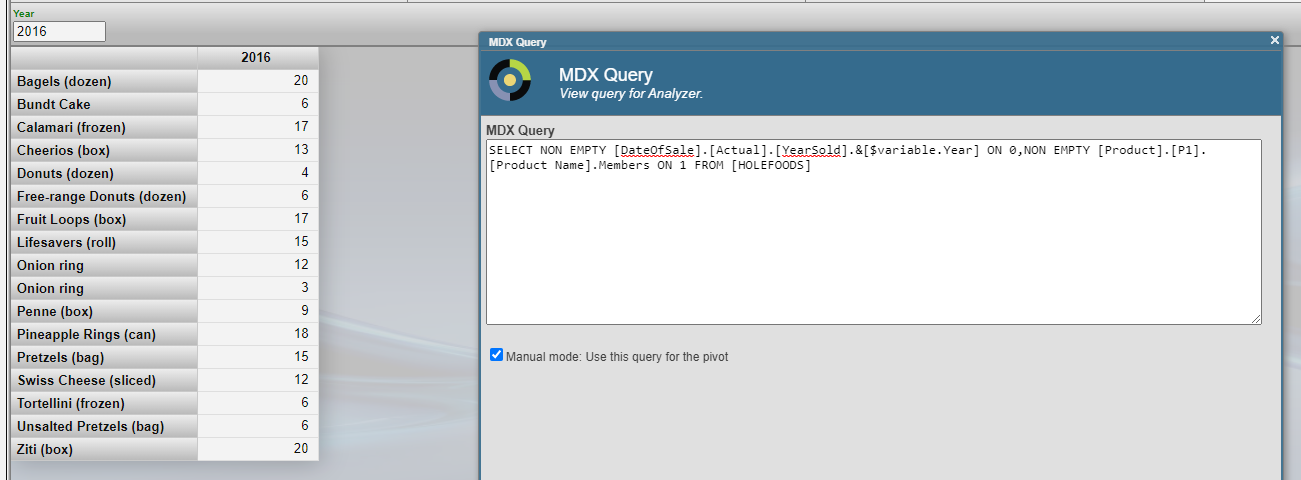
I have this MDX:

SELECT
  NON EMPTY [DateOfSale].[Actual].[YearSold].&[$variable.Year] ON 0,
  NON EMPTY [Product].[P1].[Product Name].Members ON 1
FROM [HOLEFOODS]

And with pivot variable Year equal to, say, 2016 it works:

Now I want to add previous year first with one pivot variable and one explicit reference. It also works:

0 3
0 124
Article
· May 11, 2021 8m read
IRIS in Astronomy

In this article we are going to show the results of the comparision between IRIS and Postgress when handling Astronomy data.

Introduction

Since the earliest days of human civilization we have been fascinated by the sky at night. There are so many stars! Everybody has dreamed about them and fantasized about life in other planets.

10 7
0 706

When you have been using cubes for business intelligence in a namespace for some time, you may find that there are many cubes in the namespace, only some of which are actively being used. However, it can be difficult to tell which cubes users are or are not querying, and maintaining unused cubes can be costly both in terms of storage and of computation to keep them up to date. This article provides some suggestions and examples for monitoring which cubes are in active use, and for removing cubes that you determine are no longer necessary.

5 2
2 454

When creating pivots in DeepSee, there is the ability to group date dimensions by Day, Week, Month, Quarter, Year. For some of our reporting the Week option is desired. However the display looks like the image shown below. Notice the "YYYYW##" formatting.

Is there any ability within DeepSee to modify the display of grouped week dates? E.g. instead of 2020W14 it could be 03/30/2020-04/05-2020, or even just the start or end date, etc.

0 2
1 153

Episode 17 of Data Points features a roundtable conversation with Carmen Logue, Benjamin De Boe, and Thomas Dyar about the Analytics & AI area of the InterSystems technology stack. Learn from these product experts about the various technologies and partnerships that exist within the Analytics & AI space at InterSystems, how some customers use these tools, and what might be coming in the future.

https://5e18edf067eb59-03854285.castos.com/player/408391
[This is an embedded link, but you cannot view embedded content directly on the site because you have declined the cookies necessary to access it. To view embedded content, you would need to accept all cookies in your Cookies Settings]

1 0
1 185

Dear Folks,

I have recently studied deepsee and developed few dashboards needed for our web app users. I am trying to embed them in our existing web app which uses angular with delegated user access. I need to embed the native IRIS dashboard into it. ( I can't use Highcharts or any other js tools).

How do I setup the dashboards to work with delegated authentication (Without providing access to management portal or other parts) ? Also should I use the default csp/{Namespace}/_DeepSee.UserPortal.DashboardViewer.zen? or any other web application URL ?

Thanks

0 1
0 192
Announcement
· Mar 15, 2021
FHIR Analytics

Hi developers,

We have received quite a lot of interest in using SQL on FHIR data. As you know, FHIR data is encoded in the form of a complex directed graph, and thus you can not easily query it with traditional SQL queries or business intelligence tools. Some customers have noticed that the "FHIR search tables" in IRIS for Health have flattened part of the FHIR graph, and have tried to use them for analytics. This is an undocumented and unsupported part of IRIS for Health, and can change without notice.

10 1
0 385

Hey Developers,

Enjoy watching this brief explanation of a new feature in IRIS RAD Studio – a new project by @José Pereira and @Henrique.GonçalvesDias:

Automated user management in IRIS RAD Studio

https://www.youtube.com/embed/-Y2kaKES8yg
[This is an embedded link, but you cannot view embedded content directly on the site because you have declined the cookies necessary to access it. To view embedded content, you would need to accept all cookies in your Cookies Settings]

6 0
0 285

Hey Developers,

See how you can use InterSystems IRIS and Alteryx together to provide analytics and insights to your users.

Using InterSystems IRIS and Alteryx

https://www.youtube.com/embed/l89QxOytjEk
[This is an embedded link, but you cannot view embedded content directly on the site because you have declined the cookies necessary to access it. To view embedded content, you would need to accept all cookies in your Cookies Settings]

3 0
0 200

The pandemic that struck the world in 2020 made everyone follow the news and the numbers that involve the COVID-19.

Why don’t you take that opportunity to create something simple and pleasant, to follow the number of vaccinations worldwide?

To face this challenge, I'm using the data provided by Our World in Data - Research and data to make progress against the world’s largest problems.

They have a dedicated repository on Github with the data of COVID-19, and I took the vaccination data to help me with my tracker.

4 4
0 355

Hi Community,

We're pleased to invite you to the online meetup with the winners of the InterSystems Analytics Contest!

Date & Time: Monday, January 4, 2021 – 10:00 EDT

What awaits you at this virtual Meetup?

  • Our winners' bios.
  • Short demos on their applications.
  • An open discussion about technologies being used, bonuses, questions. Plans for the next contests.

6 3
0 375

Hi guys!

I'd like to present you my new project: iris-analytics-notebook, a notebook approach to use IRIS analytics capabilities.

Project description

In past few years, notebooks tools like Jupyter are gaining popularity due its natural way to express ideias.

An almost unipresent tool for data scientists, notebook can also help to improve the impact of analytics tools for all sort of users.

2 0
0 227

The InterSystems IRIS has a very nice container class to allows you have your Dashboards as classes source code. It is %DeepSee.UserLibrary.Container.

With this class is possible group all your dashboard and pivot table definitions.

This is useful to automatically create your dashboards when you build your docker project and other automation scenarios.

See:

2 4
1 228

Web Crawling is a technique used to extract root and related content (HTML, Videos, Images, etc.) from websites to your local disk. This is allows you apply NLP to analyze the content and get important insights. This article detail how to do web crawling and NLP.

To do web crawling you can choose a tool in Java or Python. In my case I'm using Crawler4J. (https://github.com/yasserg/crawler4j).

1 0
1 815

Today, is important analyze the content into portals and websites to get informed, analyze the concorrents, analyze trends, the richness and scope of content of websites. To do this, you can alocate people to read thousand of pages and spend much money or use a crawler to extract website content and execute NLP on it. You will get all necessary insights to analyze and make precise decisions in a few minutes.

3 3
3 307

Hey Developers,

This week is a voting week for the InterSystems Analytics Contest! So, it's time to give your vote to the best solutions built with InterSystems IRIS.

🔥 You decide: VOTING IS HERE 🔥

How to vote?

Please meet the new voting engine and algorithm for the Experts and Community nomination:

8 3
0 282

Hi everyone,

I'm creating something to test the Analytics capabilities.

I have a table with 100k records. Consulting the data using ^%G or SELECT, everything is working fine.

But, when I create a Cube using this same class as Source, the Build results in only 1 fact.

I would like to know if anyone else faces the same situation before and have some guidance.

Some details:

1 6
0 257

Hi Community,

Please welcome the new video on InterSystems Developers YouTube:

The Freedom of Visualization Choice: InterSystems BI

https://www.youtube.com/embed/gGfpL1eKlxk
[This is an embedded link, but you cannot view embedded content directly on the site because you have declined the cookies necessary to access it. To view embedded content, you would need to accept all cookies in your Cookies Settings]

4 0
0 184

Hi Community!

We are pleased to invite all the developers to the upcoming InterSystems Analytics Contest Kick-off Webinar! The topic of this webinar is dedicated to the Analytics contest.

On this webinar, we’ll demo the iris-analytics-template and answer the questions on how to develop, build, and deploy Analytics applications using InterSystems IRIS.

Date & Time: Monday, December 7 — 12:00 PM EDT

Speakers:
🗣 @Carmen Logue, InterSystems Product Manager - Analytics and AI
🗣 @Evgeny Shvarov, InterSystems Developer Ecosystem Manager

5 4
0 241