IRIS BI

We offer you to embed business intelligence into your applications in order to give your users an opportunity to ask and answer sophisticated questions about their data. Typically, your application will include customizable dashboards that can provide insight into data from Business Intelligence models known as cubes.

In contrast with traditional BI systems that use static data warehouses, Business Intelligence keeps being constantly synchronized with the live transactional data.

5 2
0 567
Article
· Jul 4, 2023 2m read
IntegratedMLandDashboardSample

A simple data analysis example created in IntegratedML and Dashboard

Based on InterSystems' Integrated ML technology and Dashboard, automatically generate relevant predictions and BI pages based on uploaded CSV files. The front and back ends are completed in Vue and Iris, allowing users to generate their desired data prediction and analysis pages with simple operations and make decisions based on them.

# ZPM installation

zpm:USER>install IntegratedMLandDashboardSample

# Process Deployment

3 2
0 240

In today's data landscape, businesses encounter a number of different challenges. One of them is to do analytics on top of unified and harmonized data layer available to all the consumers. A layer that can deliver the same answers to the same questions irrelative to the dialect or tool being used.

11 2
1 459
Article
· Jul 27, 2018 4m read
Load a ML model into InterSystems IRIS

Hi all. Today we are going to upload a ML model into IRIS Manager and test it.

Note: I have done the following on Ubuntu 18.04, Apache Zeppelin 0.8.0, Python 3.6.5.

Introduction

These days many available different tools for Data Mining enable you to develop predictive models and analyze the data you have with unprecedented ease. InterSystems IRIS Data Platform provide a stable foundation for your big data and fast data applications, providing interoperability with modern DataMining tools.

6 2
2 1.4K

We have created a custom SDA container to store a certain kind of new, customized patient data.

We are observing a behavior in the correspoding analytics table for this custom SDA class where rows are added for a patient for which the MPI is null and the patient record does not exist.

0 2
0 312
Article
· Jul 19, 2022 7m read
Showing dates in missing periods

When we collect temporary data (the number of purchases in the store, the number of comments on the post), it may happen that there is no data for a certain period of time. In this case, this time period (hour, day, month) is not represented in the database, that is, there is not a single row for this period. In other words, there are no rows in the database for this period.

3 1
0 495

Hey Developers!

Do you want to reap the benefits of the advances in the fields of artificial intelligence and machine learning? With InterSystems IRIS and the Machine Learning (ML) Toolkit it’s easier than ever.

Join InterSystems Sales Engineers, @Sergey Lukyanchikov and @Eduard Lebedyuk, for the Machine Learning Toolkit for InterSystems IRIS webinar on Tuesday, April 23rd at 11 a.m. EDT to find out how InterSystems IRIS can be used as both a standalone development platform and an orchestration tool for predictive modelling that helps stitch together Python and other external tools.

3 1
0 510
Question
· Apr 29, 2024
IRIS Dashboard/Deepsee Queries

Hi Everyone,

We are using SQL based KPI's to display reports in IRIS dashboards. We have applied the filter functionality in these SQL based KPI reports.

I need your help for below scenario.

Below is my full report. Filter is applied on Name and Subject Name in this report.

Now I have used filter on Name and selected values 'Virat' and 'Big Show'

0 1
0 146
Announcement
· Mar 15, 2021
FHIR Analytics

Hi developers,

We have received quite a lot of interest in using SQL on FHIR data. As you know, FHIR data is encoded in the form of a complex directed graph, and thus you can not easily query it with traditional SQL queries or business intelligence tools. Some customers have noticed that the "FHIR search tables" in IRIS for Health have flattened part of the FHIR graph, and have tried to use them for analytics. This is an undocumented and unsupported part of IRIS for Health, and can change without notice.

10 1
0 416

Hello community, I need to solve a complex but trivial issue.

Given:

Two tables "Comment" and "Post". Each one contains an "Author" field, which is essentially a user ID. In these tables, each user ID represents an author. The goal is to count all participants together and then group them by month, language, and other metrics.

The question is how to do this within the IRIS ecosystem. Is it even possible to take two tables, get distinct data from them and then combine into one cube?

0 1
0 190

Hi Community,

The new video is available on InterSystems Developers YouTube Channel:

Collecting Healthcare Data with Alexa

https://www.youtube.com/embed/tl7heBWRrVQ
[This is an embedded link, but you cannot view embedded content directly on the site because you have declined the cookies necessary to access it. To view embedded content, you would need to accept all cookies in your Cookies Settings]

0 1
0 302

Dear Folks,

I have recently studied deepsee and developed few dashboards needed for our web app users. I am trying to embed them in our existing web app which uses angular with delegated user access. I need to embed the native IRIS dashboard into it. ( I can't use Highcharts or any other js tools).

How do I setup the dashboards to work with delegated authentication (Without providing access to management portal or other parts) ? Also should I use the default csp/{Namespace}/_DeepSee.UserPortal.DashboardViewer.zen? or any other web application URL ?

Thanks

0 1
0 213

Preview releases are now available for InterSystems IRIS Advanced Analytics, and InterSystems IRIS for Health Advanced Analytics! The Advanced Analytics add-on for InterSystems IRIS introduces IntegratedML as a key new feature.

9 1
3 636

Hi, Community!

I’m sure you are using Developer Community analytics built with InterSystems Analytics technology DeepSee:

You can find DC analytics n InterSystems->Analytics menu.

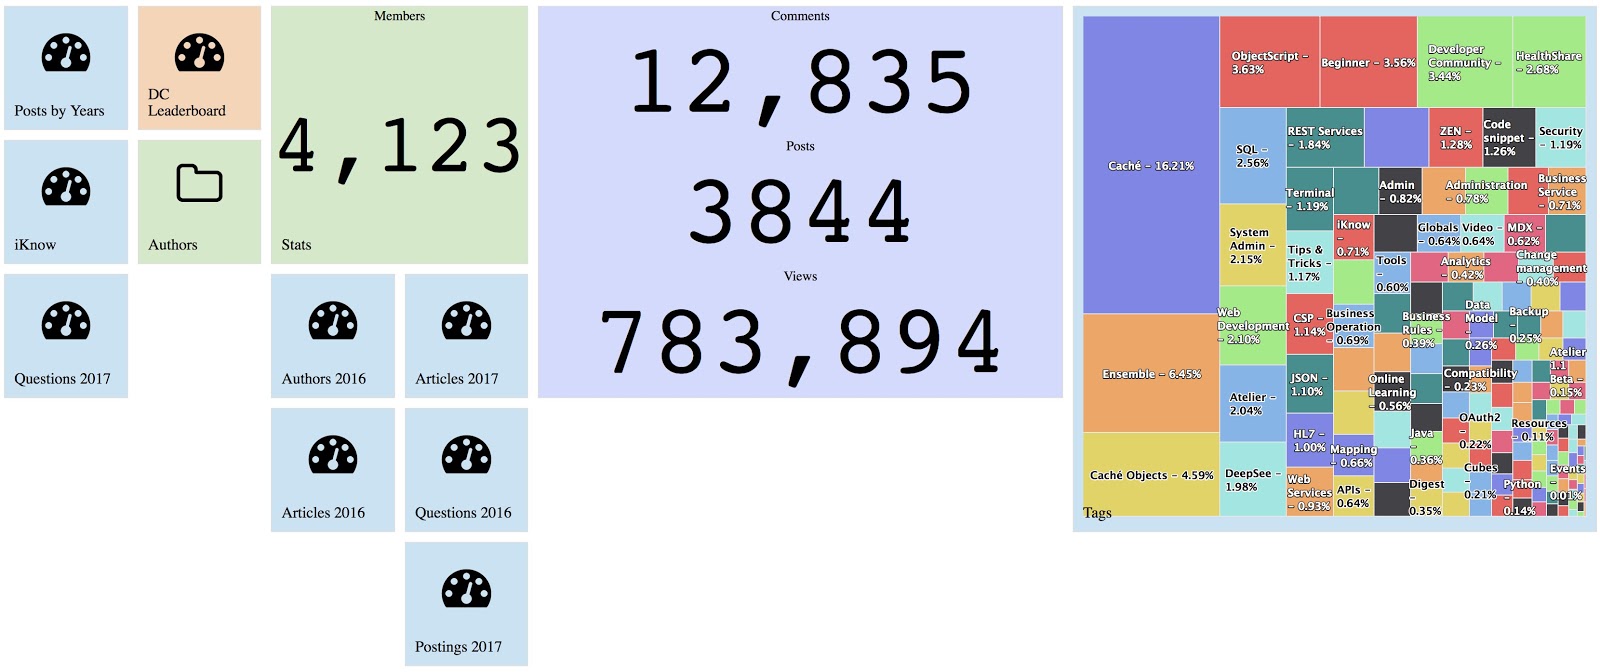
DC Analytics shows interactive dashboards on key figures of DC entities: Posts, Comments, and Members.

Since the last week, this analytics project is available for everyone with source code and data on DC Github!

2 1
1 637

I want to have a generic PercentOfAll measure that can be used for any dimension of the cube. This PercentOfAll should act like Count, but instead of showing the number of rows in a cell, it will show the percentage (100*number of rows for that member/all rows) .It should not matter what dimension is being viewed. Ex

There are a total of 100 rows in the source class.

1 1
0 374

Making a Chart using Intersystems IRIS + Python

How to use the IRIS Native API in Python to access globals and plot some charts.

Why Python?

With a large adoption and use in the world, Python have a great community and a lot of accelerators | libraries to deploy any kind of application.
If you are curious (https://www.python.org/about/apps/)

4 1
0 472

When we are at the starting stage of BI project development, we must remember that it is crucial to select the right tool for its implementation. Today we want to show you how one of the principal functionality of dashboards is implemented in different BI systems. Let's talk about drill down from both points of view: the dashboard development, and the convenience and clarity for the end user. We will touch on the applications of this technology in IRIS BI, Power BI and Tableau.

3 1
0 814

Creating information dashboards, pivot tables, and widgets is an important step in analysis that provides valuable sources of information for informed decision-making. The IRIS BI platform offers many opportunities to create and customize these elements. In this article, we will take a closer look at the basic techniques for developing them and the importance of using them.

7 1
0 487

Hey Developers,

Learn about InterSystems Reports, powered by Logi Analytics, a report-generation tool that enables you to rapidly create and view visual reports of your data.

A Look at InterSystems Reports

https://www.youtube.com/embed/mmA5ArAMLSU
[This is an embedded link, but you cannot view embedded content directly on the site because you have declined the cookies necessary to access it. To view embedded content, you would need to accept all cookies in your Cookies Settings]

3 1
0 373
Article
· Nov 26, 2019 3m read
Designing valid hierarchies in DeepSee

When designing a hierarchy in DeepSee, a child member must have only one parent member. In the case where a child corresponds to two parents, the results can become unreliable. In the case where two similar members exist, their keys must be changed so that they are unique. We will take a look at two examples to see when this happens and how to prevent it.

5 1
1 859
Article
· Nov 27, 2023 4m read
What about DMN?

A few months ago, I faced a significant challenge: streamlining the handling of business logic in our application. My goal was to extract the business logic from the code and hand it over to analysts. Dealing with a multitude of rules could easily result in a code littered with countless "if" statements, especially if the coder lacked an understanding of cyclomatic complexity. Such code becomes a source of pain for those working with it—difficult to write, test, and develop.

3 1
0 310

The following post outlines a more flexible architectural design for DeepSee. As in the previous example, this implementation includes separate databases for storing the DeepSee cache, DeepSee implementation and settings, and synchronization globals. This example introduces one new databases to store the DeepSee indices. We will redefine the global mappings so that the DeepSee indices are not mapped together with the fact and dimension tables.

2 1
0 641