Sometimes your client may request documentation of your BI or interoperability project in a formal document. In this case, MS Word is a good alternative, as it has an advanced editor that allows you to generate professional documentation. Now it's possible!
The iris4word app has this functionality!
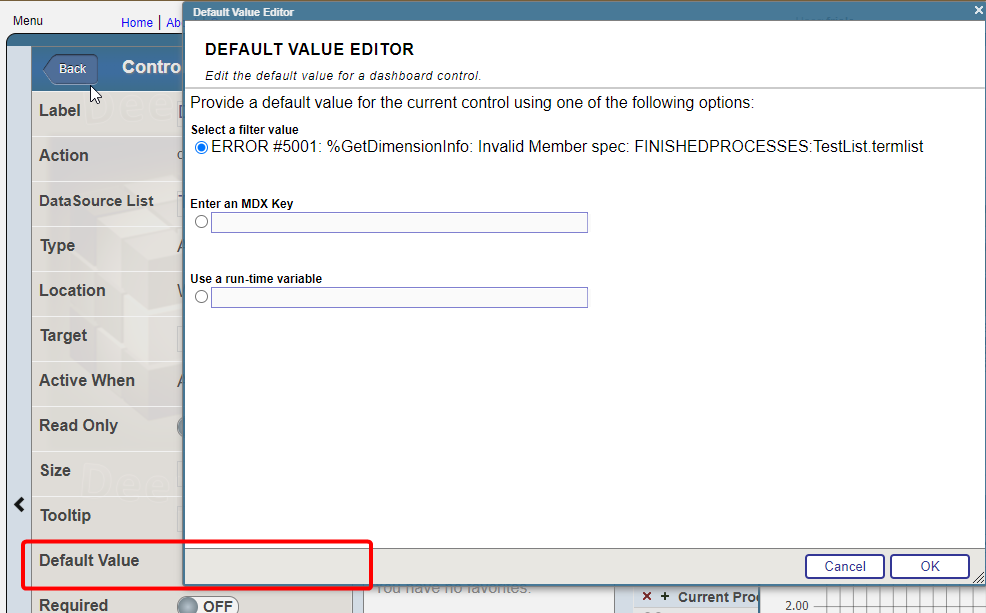
| Final MS Word Document | Word Template |
.png) |
|
iris4word business logic
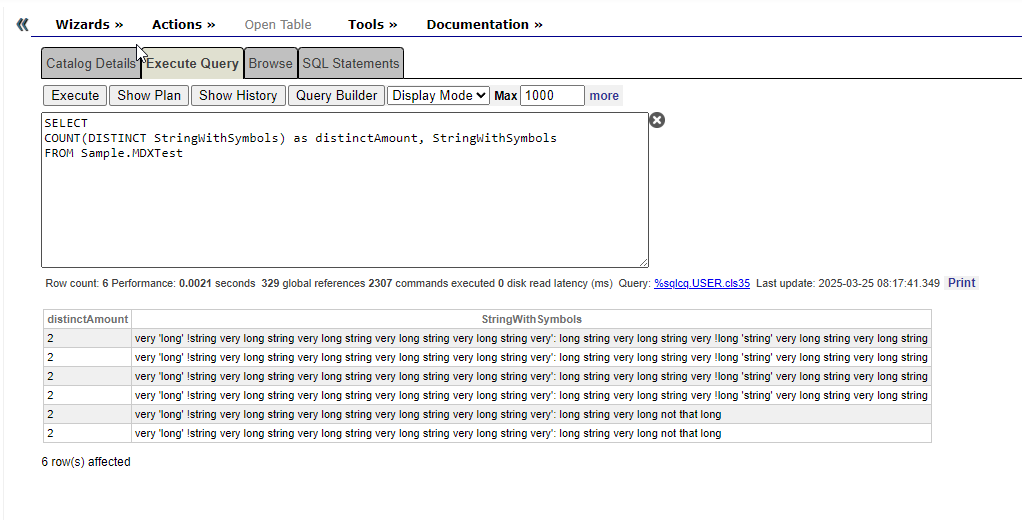
the iris4word get BI asset list and metadata using the InterSystems IRIS BI REST API documented on (https://docs.intersystems.com/healthconnectlatest/csp/docbook/DocBook.UI.Page.cls?KEY=D2CLIENT_rest_api).

.png)
.png)