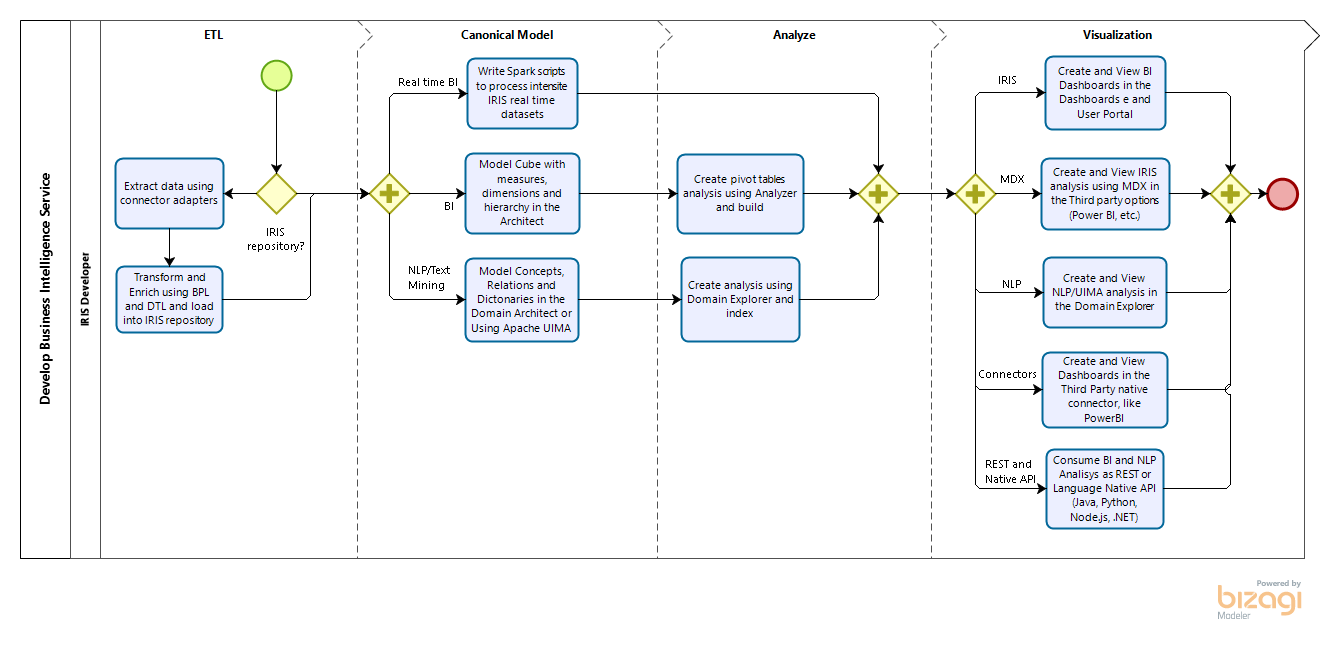
AnalyzeThis is a tool for getting a personalized preview of your own data inside of InterSystems BI. This allows you to get first hand experience with InterSystems BI and understand the power and value it can bring to your organization. In addition to getting a personalized preview of InterSystems BI through an import of a CSV file with your data, Classes and SQL Queries are now supported as Data Sources in v1.1.0!

4 4
0 490

Making a Chart using Intersystems IRIS + Python

How to use the IRIS Native API in Python to access globals and plot some charts.

Why Python?

With a large adoption and use in the world, Python have a great community and a lot of accelerators | libraries to deploy any kind of application.
If you are curious (https://www.python.org/about/apps/)

4 1
0 382

Now available on Open Exchange is a library of third party charts available to use within DeepSee/InterSystems IRIS BI dashboards. To start, simply download and install, select the new portlet as the widget type, then select the chart type that you desire. If you don't find the type of chart you are looking for, you can easily extend the portlet to implement your desired chart type. These new chart types can be used within existing dashboards or you can create new dashboards using them.

4 0
0 762

The pandemic that struck the world in 2020 made everyone follow the news and the numbers that involve the COVID-19.

Why don’t you take that opportunity to create something simple and pleasant, to follow the number of vaccinations worldwide?

To face this challenge, I'm using the data provided by Our World in Data - Research and data to make progress against the world’s largest problems.

They have a dedicated repository on Github with the data of COVID-19, and I took the vaccination data to help me with my tracker.

4 4
0 293

When we are at the starting stage of BI project development, we must remember that it is crucial to select the right tool for its implementation. Today we want to show you how one of the principal functionality of dashboards is implemented in different BI systems. Let's talk about drill down from both points of view: the dashboard development, and the convenience and clarity for the end user. We will touch on the applications of this technology in IRIS BI, Power BI and Tableau.

3 1
0 386
Article
· Aug 2, 2020 1m read
Application Errors Analytics

Hi Developers!

As you know the application errors live in ^ERRORS global. They appear there if you call:

d e.Log() 

in a Catch section of Try-Catch.

With @Robert Cemper's approach, you can now use SQL to examine it.

Inspired by Robert's module I introduced a simple IRIS Analytics module which shows these errors in a dashboard:

3 5
1 283

When using Related Cubes in InterSystems IRIS BI, cubes must be built in the proper order. The One side must be built before the Many side. This is because during build time for the Many side, it looks up the record on the One side and creates a link. If the referenced record is not found on the One side, a Missing Relationship build error is generated. The One side is going to be the independent side of the relationship, AKA the side of the relationship that is referenced by the Many side or the Dependent cube. For example: Patients contain a reference to their Doctor.

3 0
0 417
Article
· Aug 13, 2021 4m read
Building Analytics Solution with IRIS

Hi developers!

How to build an analytics solution with InterSystems IRIS?

To begin with, let's agree on the points of what is the analytics solution - and this could be a very wide topic. Let's limit the set of solutions to those you can present in the Analytics contest.

There are three kinds of analytics solutions that we will review here: monitoring, interactive analytics, and reporting.

Monitoring

The typical monitoring solution consists of an online dashboard with KPIs that are being actively updated.

The key use case is of monitoring is to visually observe the KPI of fresh data every moment to react in case of an emergency.

Interactive Analytics

This solution supposes a set of interactive dashboards with filters and drill-downs.

The key use case is to explore the data with filters and drill-downs making business decisions upon graph and table data visualization.

Reporting

Reporting solution provides a set of static (usually) reports in a form of HTML or pdf documents that deliver the data in graph and text form in a predesigned form and could be sent via email.

The typical use case of a reporting system is to obtain reports on a given period that will illustrate the status of the product, process, service, sales, etc that is crucial for the business.

How InterSystems products could be used to build such solutions? Let's discuss this below!

3 0
1 308

Previously I have already tried to play with Google Data Studio when I connected it to InterSystems FHIRaaS. It has quite a nice UI, with a few chart types available out of the box, it can be quite easily connected to some plain tables (stored as CSV or JSON, for instance), and gives the ability to build quite flexible analytics over it. So, I have decided to implement a new connector to InterSystems Analytics (DeepSee), with the ability to select a cube and do some queries on it.

3 0
0 287
Article
· Nov 15, 2022 6m read
How to develop in Logi

Today we will talk about InterSystems Reports. This is a BI system that provides you with tools to create static reports and export them to different file formats. We will see how it works using the DC Analytics public analytical sample as an example. In this article, we will examine how to familiarize yourself with the reports available in the repository, how to make a new report based on a ready-made data structure, and how to prepare a data structure from scratch.

3 0
0 386

Today, is important analyze the content into portals and websites to get informed, analyze the concorrents, analyze trends, the richness and scope of content of websites. To do this, you can alocate people to read thousand of pages and spend much money or use a crawler to extract website content and execute NLP on it. You will get all necessary insights to analyze and make precise decisions in a few minutes.

3 3
3 266
Article
· Jul 4 2m read
IntegratedMLandDashboardSample

A simple data analysis example created in IntegratedML and Dashboard

Based on InterSystems' Integrated ML technology and Dashboard, automatically generate relevant predictions and BI pages based on uploaded CSV files. The front and back ends are completed in Vue and Iris, allowing users to generate their desired data prediction and analysis pages with simple operations and make decisions based on them.

# ZPM installation

zpm:USER>install IntegratedMLandDashboardSample

# Process Deployment

3 2
0 141
Article
· Jul 19, 2022 7m read
Showing dates in missing periods

When we collect temporary data (the number of purchases in the store, the number of comments on the post), it may happen that there is no data for a certain period of time. In this case, this time period (hour, day, month) is not represented in the database, that is, there is not a single row for this period. In other words, there are no rows in the database for this period.

3 1
0 322
Article
· Dec 31, 2019 3m read
Portlets that use data from DeepSee


In the previous part of this series, we saw how to reference a web page that will enhance our dashboard experience. Now we will look into referencing data that is already in our cubes.

In this example, we will be referencing the controller object and we will be extracting data from it. This data will then be displayed as text in our Dashboard. In Part 5, we will show how to incorporate this data into other charting libraries.

2 0
0 204

In the previous part of this series, we saw how to include data in a portlet from within DeepSee. This used the built in data controller. In this part, we are going to be pulling in data from outside of DeepSee. This will include both information from within InterSystems IRIS and from the OS.

Why use this?

This is useful if you would like to create a dashboard that only contains information about your system. It is also useful if you want to display data about your system along side data that you have stored in DeepSee.

2 0
0 299
Article
· Nov 20, 2020 2m read
Enrich your analytics projects with NLP

According IDC, 80% of all data produced are NoSQL. See:

There are digital documents, scanned documents, online and offline texts, blob content into SQL, images, videos and audio. Imagine a Corporate Analytics initiative without all these data to analyze and support decisions?

In all the world, many projects are using techonologies to transform these NoSQL data into textual content, to allows analyze it. See:

2 0
2 213

Hello Community,

Thank you all for your continued feedback and support of our ad hoc reporting platform, VDM. There's been some questions around setting up a non-ODBC connection for InterSystems platforms. We published a new YouTube video showing the steps necessary to connect to InterSystems Caché and InterSystem IRIS with BridgeWorks VDM.

2 0
3 212

Preview Mode was added to InterSystems IRIS Business Intelligence to give designers a quick view of what their resulting Pivot Table will look like without needing to wait for the results to fully execute. This can be beneficial when designing pivot tables because if you are dragging and dropping elements to see how they look/work in your pivot table and seeing if they have the desired data. Since you are exploring and designing, you don't necessarily care about the results at the moment, but you would still like to see how your table looks with the changes you have made.

2 0
0 340

The InterSystems IRIS has a very nice container class to allows you have your Dashboards as classes source code. It is %DeepSee.UserLibrary.Container.

With this class is possible group all your dashboard and pivot table definitions.

This is useful to automatically create your dashboards when you build your docker project and other automation scenarios.

See:

2 4
1 201
Article
· Jan 14, 2022 1m read
Real Webserver Logs Dataset

I'm happy to share with the community a web server log dataset from our longtime customer, an operating company.

Their webserver operates on Apache webserver and contains data which can be useful to analyse a load and search engines activity.

After installing the project, you will get the data for a few months that can show a typical load and activity of clients, robots and also you can see how it depends on day of week, holidays and time of a day.

The Cube is also included in package.

2 0
0 214
Article
· Jun 13 2m read
OEX mapping #2

Technology Strategy

When I started this project I had set myself limits:
Though there is a wide range of almost ready-to-use modules in various languages
and though IRIS has excellent facilities and interfaces to make use of them
I decided to solve the challenge "totally internal" just with embedded Python, SQL, ObjectScript
Neither Java, nor Nodes, nor Angular, PEX, ... you name it.
The combination of embedded Python and SQL is preferred. ObjectScript is just my last chance.

2 0
0 84