Random Read IO Storage Performance Tool
New Tool Available
Please see PerfTools IO Test Suite for a later version of the Random Read IO tool.
Purpose
This tool is used to generate random read Input/Output (IO) from within the database. The goal of this tool is to drive as many jobs as possible to achieve target IOPS and ensure acceptable disk response times are sustained. Results gathered from the IO tests will vary from configuration to configuration based on the IO sub-system. Before running these tests ensure corresponding operating system and storage level monitoring are configured to capture IO performance metrics for later analysis.
Methodology
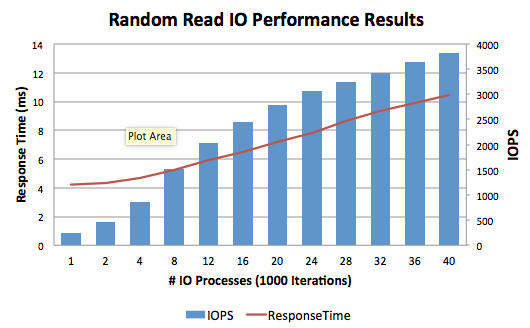
Start with a small number of processes and 10,000 iterations per process. Use 100,000 iterations per process for all-flash storage arrays. Then increase the number of processes, e.g. start at 10 jobs and increase by 10, 20, 40 etc. Continue running the individual tests until response time is consistently over 10ms or calculated IOPS is no longer increasing in a linear way.
As a guide, the following response times for 8KB and 64KB Database Random Reads (non-cached) are usually acceptable for all-flash arrays:
- Average <= 2ms
- Not to exceed <= 5ms
The tool requires an empty pre-expanded IRIS.DAT database to be at least double the size of memory in the server and at least four times the storage controller cache size. The database needs to be larger than memory to ensure reads are not cached in file system cache.
The tool uses the ObjectScript VIEW command which reads database blocks in memory so if you are not getting your expected results then perhaps all the database blocks are already in memory.
Specifications and Targets
Complete the following table with your environment specifications and targets:
| Specification | Example |
|---|---|
|
Storage
|
Storage array specification |
|
Physical Server
|
CPU, Memory specification |
|
Virtual machine
|
Red Hat Enterprise Linux 7
24 vCPU, 40GB vRAM
|
|
Database size
|
200GB
|
|
Shared memory
|
Allocated 26956MB shared memory using Huge Pages: 24000MB global buffers, 1000MB routine buffers
|
|
Target IOPS
|
2000 |
|
Target response time
|
<=5ms |
Installation
Download the PerfTools.RanRead.xml tool from GitHub here.
Import PerfTools.RanRead.xml into USER namespace.
USER> do $system.OBJ.Load("/tmp/PerfTools.RanRead.xml","ckf")Run the Help method to see all entry points. All commands are run in %SYS.
USER> do ##class(PerfTools.RanRead).Help()

InterSystems Random Read IO Performance Tool
--------------------------------------------
do ##class(PerfTools.RanRead).Setup(Directory,DatabaseName,SizeGB,LogLevel)
    - Creates database and namespace with the same name. The log level must be in the range of 0 to 3, where 0 is “none” and 3 is “verbose”.
do ##class(PerfTools.RanRead).Run(Directory,Processes,Iterations)
    - Run the random read IO test.
do ##class(PerfTools.RanRead).Stop()
    - Terminates all background jobs.
do ##class(PerfTools.RanRead).Reset()
    - Deletes all random read history stored in ^PerfTools.RanRead*
do ##class(PerfTools.RanRead).Export(directory)
    - Exports a summary of all random read test history to tab delimited text file.
Setup
Create an empty (pre-expanded) database called ZRANREAD approximately twice the size of the memory of the physical host to be tested. Ensure empty database is at least four times the storage controller cache size. You can create manually or use the following method to automatically create a namespace and database.
USER> do ##class(PerfTools.RanRead).Setup("/usr/iris/db/zranread","ZRANREAD",100,1)

Creating 100GB database in /usr/iris/db/zranread/
Database created in /usr/iris/db/zranread/
Run %Installer Manifest...
2016-05-23 13:33:59 0 PerfTools.RanRead: Installation starting at 2016-05-23 13:33:59, LogLevel=1
2016-05-23 13:33:59 1 CreateDatabase: Creating database ZRANREAD in /usr/iris/db/zranread// with resource
2016-05-23 13:33:59 1 CreateNamespace: Creating namespace ZRANREAD using ZRANREAD/ZRANREAD
2016-05-23 13:33:59 1 ActivateConfiguration: Activating Configuration
2016-05-23 13:34:00 1 EnableEnsemble: Enabling ZRANREAD
2016-05-23 13:34:00 1 ActivateConfiguration: Activating Configuration
2016-05-23 13:34:00 0 PerfTools.RanRead: Installation succeeded at 2016-05-23 13:34:00
2016-05-23 13:34:00 0 %Installer: Elapsed time 1.066633s
Database /usr/iris/db/zranread/ ready for testing.
do ##class(PerfTools.RanRead).Run(directory,processes,iterations) e.g.
do ##class(PerfTools.RanRead).Run("/usr/iris/db/zranread/",1,10000)
Run
Execute the Run method increasing the number of processes and taking note of the response time as you go.
If the tests are too quick or the results are not as expected then increase the number of iterations to 10000.
USER> do ##class(PerfTools.RanRead).Run("/usr/iris/db/zranread",20,10000)

InterSystems Random Read IO Performance Tool
--------------------------------------------
Starting 20 jobs in the background.
To terminate jobs run:  do ##class(PerfTools.RanRead).Stop()
Waiting for jobs to finish.........................
Random read background jobs finished.
20 processes (1000 iterations) average response time = 7.18ms
Calculated IOPS = 2787
Results
The results for each run are saved in USER in SQL table PerfTools.RanRead. Run the following SQL query to see a summary of results.
SELECT RunDate,RunTime,Database,Iterations,Processes,
    {fn ROUND(AVG(ResponseTime),2)} As ResponseTime,
    {fn ROUND(AVG(IOPS),0)} As IOPS
FROM PerfTools.RanRead
GROUP BY Batch
To export the result set to a tab delimited text file run the following:
USER> do ##class(PerfTools.RanRead).Export("/usr/iris/db/zranread/")

Exporting summary of all random read statistics to /usr/iris/db/zranread/PerfToolsRanRead_20160523-1408.txt
Done.
Analysis
Open the exported text file in Excel, then copy and paste into the PerfToolsRandomRead_Analysis_Template.xlsx spreadsheet for charting.
The sample spreadsheet can be downloaded from GitHub here.
Clean Up
After finished running the tests purge the history by running:
%SYS> do ##class(PerfTools.RanRead).Reset()
Comments
Thank you for this great tool, Tony!
One question: is it possible instead of importing into %SYS, import to OTHERNAMESPACE and map the package to %All?
Good article Tony. Thanks!
Great Tool!
But running test on two databases sitting on two different storage types reveals something we didn't expect. The DB with less IOPS (reported by the tool) actually performs better with real Ensemble data, especially when searching is involved. Perhaps random reads isn't a good indicator to determine overall DB performance?
Thanks!
Hi Evgeny,
Yes, you can import into an OTHERNAMESPACE and map the package to the %ALL namespace. As a test I created the %ALL namespace then imported the PerfTools.RanRead.xml into the USER namespace. Next I created a package mapping in the %ALL namespace to the PerfTools.RandRead class in the USER database. Then I ran the tool in %SYS as documented above and it tested ok.
Tony
Good news, thanks!
My question was because importing smth to %SYS needs temporary write permission to CACHELIB database to be turned on and everything installed in %SYS will be erased with the next Caché update.
Hi Yuriy,
That's right, the purpose of the Random Read Tool is to simply return a metric to compare storage throughput and not to determine overall DB performance. When looking at the overall performance of the DB a lot of other factors come into play. Check out these great long read articles on understanding and analysing performance:
InterSystems Data Platforms and performance:
– Part 1: Getting started on the Journey, collecting metrics
– Part 2: Looking at the metrics we collected
– Part 3: Focus on CPU
– Part 4: Looking at Memory
Just a hint... if you are running Linux you can use shell to quickly script a progression of runs for example starting with 2 processes stepping up in 2's to 30 processes.
for i in `seq 2 2 30`; do echo "do ##class(PerfTools.RanRead).Run(\"/db/RANREAD\",${i},10000)" | csession H2015 -U "%SYS"; done
Piping the command to csession requires that Operating-system–based authentication is enabled and your unix shell user exists in Caché.
See: Configuring for Operating-System–based Authentication in DocBook
For newer storage, especially all flash, 10,000 iterations will be too quick, change this to 100,000 for sustained read activity -- it should be less than a minute on SSD storage for each step. For example using the above example;
for i in `seq 2 2 30`; do echo "do ##class(PerfTools.RanRead).Run(\"/db/RANREAD\",${i},100000)" | csession CACHEINSTNAME -U "%SYS"; done
On Linux use Asynchronous IO (asyncio) for RANREAD testing.
asyncio enables direct IO for database reads and writes which bypasses file cache at the OS and LVM layers
NOTE: Because direct IO bypasses filesystem cache, OS file copy operations including Caché Online Backup will be VERY slow when direct IO is configured.
Add the following to [config] section of the cache.cpf and restart Caché/HealthShare/IRIS: wduseasyncio=1
It might be helpful if you just have a 15-minute pButtons to run while RANREAD runs to see operating system io stats, eg iostat.
From zn "%SYS"
%SYS>set rc=$$addprofile^pButtons("15_minute","15 minute only", "1", "900")
%SYS>d ^pButtons
Current log directory: /trak/backup/benchout/pButtonsOut/
Available profiles:
     1  12hours     - 12 hour run sampling every 10 seconds
     2  15_minute   - 15 minute only
     3  24hours     - 24 hour run sampling every 10 seconds
     4  30mins      - 30 minute run sampling every 1 second
     5  4hours      - 4 hour run sampling every 5 seconds
     6  8hours      - 8 hour run sampling every 10 seconds
     7  test        - A 5 minute TEST run sampling every 30 seconds
select profile number to run:
Murray,
Do you recommend this setting (wduseasyncio=1) for production as well? If it slows down all disk i/o, what will happen with journaling?
Hi, good question. The answer is the typical consultant answer... it depends. The temptation is to offer a "Best Practice" answer, but really, there are no best practices, just what's best for you or your customer's situation. If your storage performance is OK then keep monitoring, but you don't have to change anything. If you are having storage performance problems, or your capacity planning says you will need to scale and optimise, then you need to start looking at strategies available to you. Direct IO is one, but there are others. What you have prompted me to do is think about a community post bringing together storage options, especially now as we have moved into a time of all-flash SSD, NVMe, Optane..... So, I got this far without any answer at all...
A quick summary, because it will take a while to write a new post. Direct I/O is a feature of the file system whereby file reads and writes go directly from the application to the storage device, bypassing the operating system read and write caches. Direct I/O is used only by applications (such as databases) that manage their own caches.
For Caché and IRIS Journals already do direct IO to ensure the journal really is persisted to disk, not in a buffer.
InterSystems do recommend Direct I/O in some situations specifically, for example for HCI on Linux because we do need to optimise IO on these platforms (vSAN, Nutanix, etc). See the HCI Post. Direct I/O is enabled for reads AND writes with the [config] setting wduseasyncio=1. This also enables asynchronous writes for the write daemon. There can be situations, like Caché online backup that is doing a lot of sequential writes, or where there is continuous database writes, like a database build with a lot of database expansions where OS write cache is an advantage. So don't think Direct I/O is an answer to every situation. If you are using a modern backup technology like snapshots then you will be fine tho'.
MO
Hi Murray,
Thank you for responding.
You mentioned earlier that switching to Direct I/O would slow down Caché On-line Backup; it sounded strange for me: if database I/O and journal I/O can use different strategies, why On-line Backup can't always use buffered I/O regardless of database I/O strategy?
Hi Alexey,
I can help with your question. The reason this is the way it is because you can't (or at least shouldn't) have a database file (CACHE.DAT or IRIS.DAT) opened in contending modes (open both as unbuffered and buffered) to avoid file corruption or stale data. Now the actual writing of the online backup CBK file can be a buffered write because it is independent of the DB as you mentioned, but the actual reads of the database blocks from the online backup utility will be unbuffered direct IO reads. This is where the slow-down may occur: from the reading the database blocks and not the actual writing of the CBK backup file.
Regards,
Mark B-
New version now available with the following changes:
• Import into USER namespace so the data is stored in USER so there is no need to change CACHELIB to RW.
• The RanRead processes will not start until all the processes have started so they’ll all kick off the iterations at the same time.
Tony
Hi Tony!
Thanks for sharing!
Could you please submit the repo to Open Exchange too to expand the audience?
💡 This article is considered as InterSystems Data Platform Best Practice.
Good article Tony