I wanted to run the cache programming from the windows command line promt and also with linux commands. Please let me know the procedure.
Hi Everybody,
I'm trying to restore database to a 2016.2.2.853 caché version but i've some problems ...
Into my backup file, i've 6 namespaces. After use the Do ^DBREST and configure all namespace into the portal, I can only reach 2 of 6.
when I write zn "blabla" into the terminal, i've got this error message :
ZN "blabla"
^
<DIRECTORY> *r:\data\blabla
Of course, Database and namespace are correctly define.
I've try this on a previous version of caché (2015.2.2.811) and it's working fine.
So, do you already got this kind of issue with your caché server ?
Tanks a lot for your help!
Sam
With the recent release of Caché and Ensemble 2017.1, InterSystems customers can now create configurations where the data-at-rest cryptographic library used is compliant with FIPS 140-2.
Caché and Ensemble now provides you with the option to enable FIPS mode on RedHat 6.6, 7.1 on x86-64. This means is, that InterSystems products will no longer use the supplied crypto libraries that come with the kit, but will use the FIPS validated libraries provided by the Operating Systems vendor.
To configure your system, RedHat must operating in FIPS mode.
The last version of Caché, Ensemble released for VSI OpenVMS is 2017.1. Unlike HP OpenVMS (Alpha and Itanium), VSI OpenVMS on Itanium continues to be supported. This means that critical corrections or changes required to support customer’s hardware purchases will all be based on 2017.1 or earlier versions.
Related announcement: https://community.intersystems.com/post/platform-compatibility-hp-open-…
Hi ,
We are trying to import file using %installer . But we are getting error.
CODE:
Include %occInclude Class User.InsClass { // You can see generated method in zsetup+1^App.Installer.1 XData Install [ XMLNamespace = INSTALLER ] {
Prompted by this post about accessing a global at its original location after you have changed a mapping, here's a tip about one specific dropdown in Portal that's sometimes useful.
I heed to his a callback method after all REST call. I have already found a method to call before REST call, but after eludes me. Here's the code:
Class Test.REST Extends %CSP.REST
{

XData UrlMap [ XMLNamespace = "http://www.intersystems.com/urlmap" ]
{
<Routes>

<Route Url="/:classname" Method="GET" Call="TEST" Cors="true"/>

</Routes>
}

/// This method Gets called prior to dispatch of the request. Put any common code here
/// that you want to be executed for EVERY request. If pContinue is set to 0, the
/// request will NOT be dispatched according to the UrlMap. If this case it's the
/// responsibility of the user to return a response.
ClassMethod OnPreDispatch(pUrl As %String, pMethod As %String, ByRef pContinue As %Boolean) As %Status
{
    set ^CacheTemp.DBG($i(^CacheTemp.DBG)) = "OnPreDispatch"
    set pContinue = $$$YES
    quit $$$OK
}

ClassMethod TEST(name) As %Status
{
    set ^CacheTemp.DBG($i(^CacheTemp.DBG)) = "TEST"
    //w 1/0
    quit $$$OK
}

/// Issue an '500' error and give some indication as to what occurred
ClassMethod Http500(pE As %Exception.AbstractException) As %Status
{
    set ^CacheTemp.DBG($i(^CacheTemp.DBG)) = "Http500"
    quit ##super()
}

/// Doesn't work
ClassMethod OnPostHTTP() [ Abstract, ServerOnly = 1 ]
{
    set ^CacheTemp.DBG($i(^CacheTemp.DBG)) = "OnPostHTTP"
}

/// Doesn't work
ClassMethod OnPostHyperEvent(class As %String, method As %String) As %Status [ ServerOnly = 1 ]
{
    set ^CacheTemp.DBG($i(^CacheTemp.DBG)) = "OnPostHyperEvent"
    quit $$$OK
}

}Please let me know in Intersystems Ensemble Prodn, where the configuration setting changes gets stored ?
Has anyone begun working with Atelier and TFS for source control?
If so, experiences to share?
Thx!
Can you connect to FHIR through ensemble or do you have to have HealthShare to connect to FHIR services?
Hello all,
When I call a WSDL in php, look this code :
// Standard SOAP header for username/password
// From http://stackoverflow.com/questions/13465168/php-namespaces-in-soapheader-child-nodes
class WSSESecurityHeader extends SoapHeader {
public function __construct($username, $password)
{
$wsseNamespace = 'http://docs.oasis-open.org/wss/2004/01/oasis-200401-wss-wssecurity-sece….
Folks
1) What's the correct way to check for an existence of a segment? So far I have been doing this by checking to see if a required field is non-null, and this seems to work but is a bit clumsy. In this case, it’s an X12 message being checked in an IF action in BPL:
request.GetValueAt("NTE(1):Description")'=""
Or in a DTL, to see if a Z segment exists:
source.{ZEF:Counter}=1
2) I have a case where I need to change from an external date format (YYYYMMDD) to internal (+$H) for a DTL to create a new object (and then persist it later). I am using: +.
We finished our last lesson with our Widgets Direct page iterating over a list of widgets, displaying an ID and a Name value. While we have been able to achieve this with only a small amount of coding, the page itself is not the most visually appealing place to be. The AngularJS framework is providing a powerful Model-View-Controller framework for our structure and logic, but it does not implement anything that will provide a nice UI experience. For that we need to implement a UI toolkit.
hi
I want to find the journal records that indicate the insert/update/delete operation for my table. I can read the journal file but there is so many records and I want to know is there some method or property which can judge one journal record for insert/update/delete operation for my table?
thanks
Has anyone created Delegated Authentication using the Windows Certificate Store? Thank you for any feedback.
We are building a bunch of rest based services using Ens 2016.2 to serve our browser based application (Angular 4).
Two questions:
1. The initial authentication seems only work if credentials are placed in the url parameters. Trying to use the Authorization header instead, the client code immediately complains about Access-Control-Allow-
2. After initial authentication, what is the proper way to send subsequent rest calls without having to include credential every time?
I have Parameter UseSession As Integer = 1 in my service class, but what else do I need to do?
If your application is raising <PROTECT> errors and you're finding it hard to work out why, here's a way to get additional information.
First, if auditing is not already enabled, turn it on:
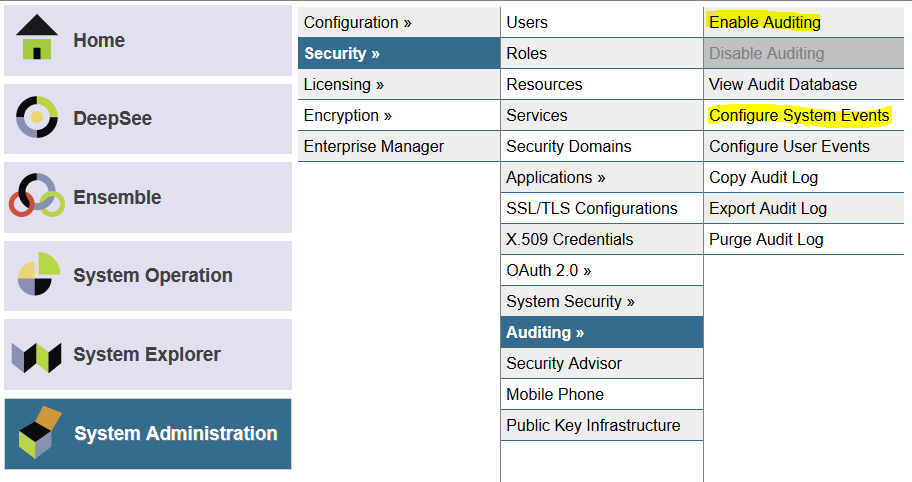
Then use "Configure System Events" (highlighted above) and locate the event named %System/%Security/Protect. In the screenshot below I used the Filter field to do this (type "protect" - highlighted below - and press TAB):
Notice that the Enabled column shows a value "No". By default <PROTECT> errors are not logged in the audit.
when the "/apps/docmatic/%CSP.SysConnection.cls" gets hit. If some page hit the above (%CSP.SysConnection) it consume license or not?
WebSockets look to be supported reasonably well in Cache. I have yet to use them in production so I am wondering how well it has worked for other developers.
In particular what happens when the browser does not support WebSockets, or when a firewall blocks the connection.
Have you had to write your own long polling fall-back?
I've read the documentation and found this interesting article...
https://community.intersystems.com/post/asynchronous-websockets-quick-tutorial
but no mention of long polling fall-backs that I can see.
Hello everyone,
Currently we have 2 Windows servers in a clustered environment. Is there a setting in HealthShare for a TCP/IP Operation to use the virtual IP address when initiating the connection, rather than the host IP address?
Thanks in advance!
I am using a %Stream.FileCharacter object and LinkToFile API to write to a file on a folder. The file is written line by line . Something like below:-
Set tStream = ##class(%Stream.FileCharacter).%New()
Set tStatus =tStream.LinkToFile("MyFileName")
For i=1:1:X { Set result = ..process(i) Do tSream.WriteLine(result) }
An external process then picks up the file at a designated time.
I am unable to find any classes that will return the status of all the services in a production. Is there one available?
hi
I backup one database and restore it to antoher new Caché server with ^DBREST, but I cannot view this db in the portal, why?
If I need some more operation?
Hi,
I am trying to send an email in a producion using the EMailAlert business operation, class EnsLib.EMail.AlertOperation using NHS Mail.
Has anyone succeeded in doing this? If so can you tell me how.
Thanks Sue
I'm a beginner for hs2014
I try to write text file in ASCII format (encode CP874) from HS2014 (run on RHEL)
I try to use
o file:"WNSK\CP874\"
o file:"RSK\CP874\"
o file:"WNSK\THAW\
o file:"WNS"
but output file still in UTF-8 encoding
please advise me
Thk.
I am working in Cache Objectscript where I need to process around 0.2 million data.
I am executing SQL query through "%Library.ResultSet"
Code Example:
Set tsRSet=##class(%Library.ResultSet).%New("<query name>")
Set status = tsRSet.Execute(<param 1>,<param2>)
While tsRSet.Next()
{
Business Logic
}
Is there any limitation of the above code when the number of records the query is fetching is high.
If the query returns 0.5 million to 1 million record will my code work properly or it may break due to high volume of data.
I have 4 GB RAM and 2 GB global buffer in my production system.
At the end of our last lesson, we ended with our page displaying a nice (but garish) Angular Material Toolbar, and our Widget data displaying in a list of Material cards. Our page feels a bit static, and we already know that the large number of Widgets that we will be dealing with will not be especially usable on a static list. What can we do to help?
A filtering function would be very helpful, so let's add a text input to the top of the page. We will bind this to a variable in the $scope - widgetFilterText so that Angular has access to the value we type in.
Hi,
We have a application developed in CSP and JS. Is there any way to make this application available in multiple language like Spanish etc.
We are ready to re-write the code in Zen also if it supports that feature.
Could any one of you please assist/advice a Solution to reach the required goal using Cache technologies, it will be a great help if someone has any sample code for the same.
Thanks
Paras
Atelier Users:
Has anyone found an Eclipse plug-in that provides the capability to connect to a Caché server and give the user a way to write SQL queries using the tables from that server? I'm picturing something like a "WinSQL"-client built as an Eclipse plugin.
I've found and tried the following, but I couldn't get it to connect to my local Caché instance.
http://eclipsesql.sourceforge.net/
I do a lot of SQL query building with the SQL tool on the Management Portal or $system.SQL.Shell() from terminal before moving the queries into my COS code.