Here at InterSystems, we often deal with massive datasets of structured data. It’s not uncommon to see customers with tables spanning >100 fields and >1 billion rows, each table totaling hundred of GB of data. Now imagine joining two or three of these tables together, with a schema that wasn’t optimized for this specific use case. Just for fun, let’s say you have 10 years worth of EMR data from 20 different hospitals across your state, and you’ve been tasked with finding….

7 1
3 76

Introduction

Database performance has become a critical success factor in a modern application environment. Therefore identifying and optimizing the most resource-intensive SQL queries is essential for guaranteeing a smooth user experience and maintaining application stability.

This article will explore a quick approach to analyzing SQL query execution statistics on an InterSystems IRIS instance to identify areas for optimization within a macro-application.

Rather than focusing on real-time monitoring, we will set up a system that collects and analyzes statistics pre-calculated by IRIS once an hour. This approach, while not enabling instantaneous monitoring, offers an excellent compromise between the wealth of data available and the simplicity of implementation.

We will use Grafana for data visualization and analysis, InfluxDB for time series storage, and Telegraf for metrics collection. These tools, recognized for their power and flexibility, will allow us to obtain a clear and exploitable view.

More specifically, we will detail the configuration of Telegraf to retrieve statistics. We will also set up the integration with InfluxDB for data storage and analysis, and create customized dashboards in Grafana. This will help us quickly identify queries requiring special attention.

To facilitate the orchestration and deployment of these various components, we will employ Docker.

logos.png

6 0
3 126

High-Performance Message Searching in Health Connect

The Problem

Have you ever tried to do a search in Message Viewer on a busy interface and had the query time out? This can become quite a problem as the amount of data increases. For context, the instance of Health Connect I am working with does roughly 155 million Message Headers per day with 21 day message retention. To try and help with search performance, we extended the built-in SearchTable with commonly used fields in hopes that indexing these fields would result in faster query times. Despite this, we still couldn't get some of these queries to finish at all.

17 0
6 89

Motivation

I didn't know about ObjectScript until I started my new job. Objectscript isn't actually a young programming language. Compared to C++, Java and Python, the community isn't as active, but we're keen to make this place more vibrant, aren't we?

I've noticed that some of my colleagues are finding it tricky to get their heads around the class relationships in these huge projects. There aren't any easy-to-use modern class diagram tool for ObjectScript.

Related Work

I have tried relavant works:

12 7
4 225

The rise of Big Data projects, real-time self-service analytics, online query services, and social networks, among others, have enabled scenarios for massive and high-performance data queries. In response to this challenge, MPP (massively parallel processing database) technology was created, and it quickly established itself. Among the open-source MPP options, Presto (https://prestodb.io/) is the best-known option. It originated in Facebook and was utilized for data analytics, but later became open-sourced.

6 0
3 210

sql-embedding cover

InterSystems IRIS 2024 recently introduced the vector types.
This addition empowers developers to work with vector search, enabling efficient similarity searches, clustering, and a range of other applications.
In this article, we will delve into the intricacies of vector types, explore their applications, and provide practical examples to guide your implementation.

5 0
1 106

So if you are following from the previous post or dropping in now, let's segway to the world of eBPF applications and take a look at Parca, which builds on our brief investigation of performance bottlenecks using eBPF, but puts a killer app on top of your cluster to monitor all your iris workloads, continually, cluster wide!

Continous Profiling with Parca, IRIS Workloads Cluster Wide

1 0
0 157
Article
· Sep 9, 2024 14m read
eBPF: Tracing Kernel Events for IRIS Workloads

I attended Cloud Native Security Con in Seattle with full intention of crushing OTEL day, then perusing the subject of security applied to Cloud Native workloads the following days leading up to CTF as a professional excercise. This was happily upended by a new understanding of eBPF, which got my screens, career, workloads, and atitude a much needed upgrade with new approaches to solving workload problems.

So I made it to the eBPF party and have been attending clinic after clinic on the subject ever since, here I would like to "unbox" eBPF as a technical solution, mapped directly to what we do in practice (even if its a bit off), and step through eBPF through my experimentation on supporting InterSystems IRIS Workloads, particularly on Kubernetes, but not necessarily void on standalone workloads.

eBee Steps with eBPF and InterSystems IRIS Workloads

3 0
1 173

It's been a long time since I didn't write an update post on IoP.

image

So what's new since IoP command line interface was released?

Two new big features were added to IoP:
- Rebranding: the grongier.pex module was renamed to iop to reflect the new name of the project.
- Async support: IoP now supports async functions and coroutines.

3 5
0 230

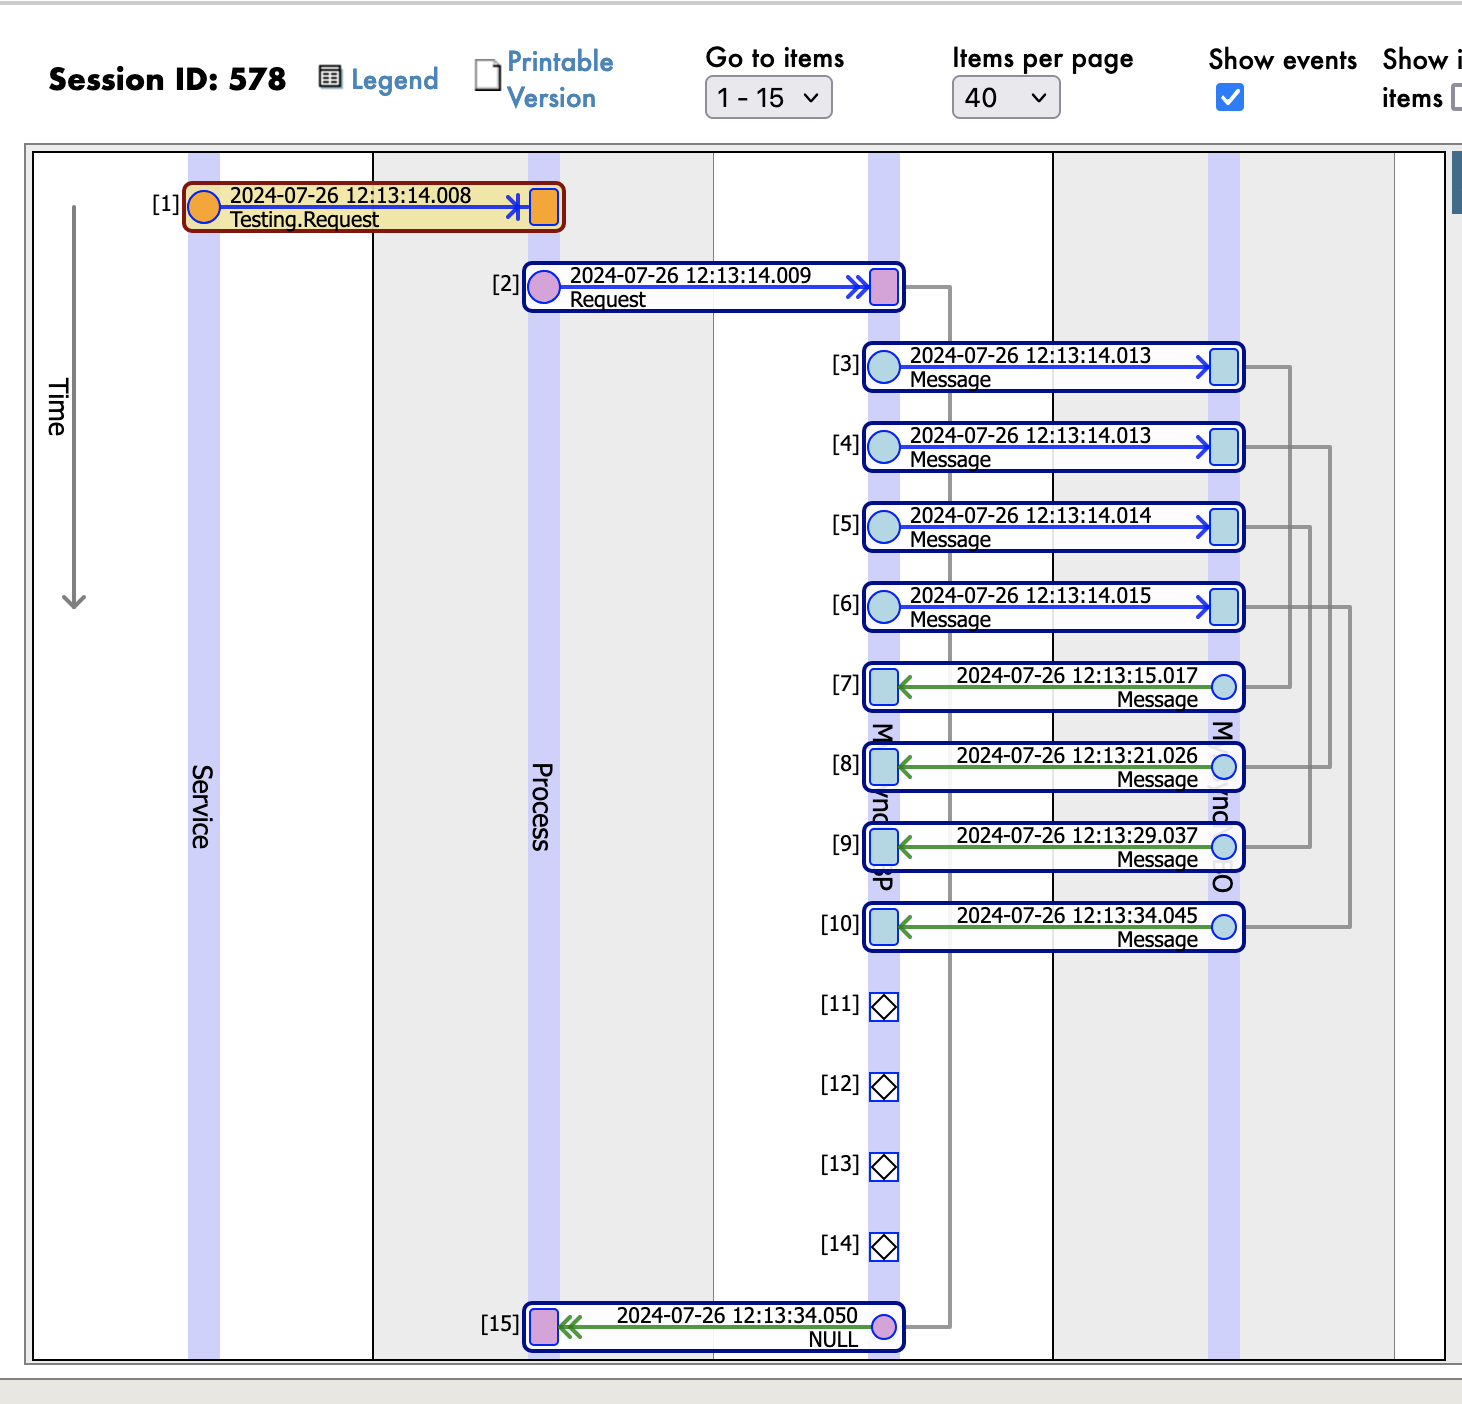
A customer recently asked if IRIS supported OpenTelemetry as they where seeking to measure the time that IRIS implemented SOAP Services take to complete. The customer already has several other technologies that support OpenTelemetry for process tracing. At this time, InterSystems IRIS (IRIS) do not natively support OpenTelemetry.

12 5
1 647

[Background]

InterSystems IRIS family has a nice utility ^SystemPerformance (as known as ^pButtons in Caché and Ensemble) which outputs the database performance information into a readable HTML file. When you run ^SystemPerformance on IRIS for Windows, a HTML file is created where both our own performance log mgstat and Windows performance log are included.

12 2
4 697

It seems like yesterday when we did a small project in Java to test the performance of IRIS, PostgreSQL and MySQL (you can review the article we wrote back in June at the end of this article). If you remember, IRIS was superior to PostgreSQL and clearly superior to MySQL in insertions, with no big difference in queries.

8 6
3 846

Windows Subsystem for Linux (WSL) is a feature of Windows that allows you to run a Linux environment on your Windows machine, without the need for a separate virtual machine or dual booting.

WSL is designed to provide a seamless and productive experience for developers who want to use both Windows and Linux at the same time**.

2 0
1 384

When there's a performance issue, whether for all users on the system or a single process, the shortest path to understanding the root cause is usually to understand what the processes in question are spending their time doing. Are they mostly using CPU to dutifully march through their algorithm (for better or worse); or are they mostly reading database blocks from disk; or mostly waiting for something else, like LOCKs, ECP or database block collisions?

15 1
4 471

Most transactional applications have a 70:30 RW profile. However, some special cases have extremely high write IO profiles.

I ran storage IO tests in the ap-southeast-2 (Sydney) AWS region to simulate IRIS database IO patterns and throughput similar to a very high write rate application.

The test aimed to determine whether the EC2 instance types and EBS volume types available in the AWS Australian regions will support the high IO rates and throughput required.

5 0
0 1.4K

InterSystems IRIS offers various ways how to profile your code, in most cases it produces enough information to find the places where the most time is spent or where the most global sets. But sometimes it's difficult to understand the execution flow and how it ended at that point.

To solve this, I've decided to implement a way to build a report in a way, so, it's possible to dive by stack down

3 4
2 344
Article
· May 25, 2023 12m read
AWS Capacity planning review example

I am often asked to review customers' IRIS application performance data to understand if system resources are under or over-provisioned.

This recent example is interesting because it involves an application that has done a "lift and shift" migration of a large IRIS database application to the Cloud. AWS, in this case.

A key takeaway is that once you move to the Cloud, resources can be right-sized over time as needed. You do not have to buy and provision on-premises infrastructure for many years in the future that you expect to grow into.

Continuous monitoring is required. Your application transaction rate will change as your business changes, the application use or the application itself changes. This will change the system resource requirements. Planners should also consider seasonal peaks in activity. Of course, an advantage of the Cloud is resources can be scaled up or down as needed.

For more background information, there are several in-depth posts on AWS and IRIS in the community. A search for "AWS reference" is an excellent place to start. I have also added some helpful links at the end of this post.

AWS services are like Lego blocks, different sizes and shapes can be combined. I have ignored networking, security, and standing up a VPC for this post. I have focused on two of the Lego block components;
- Compute requirements.
- Storage requirements.

9 1
3 1K

YASPE is the successor to YAPE (Yet Another pButtons Extractor). YASPE has been written from the ground up with many internal changes to allow easier maintenance and enhancements.

YASPE functions:

  • Parse and chart InterSystems Caché pButtons and InterSystems IRIS SystemPerformance files for quick performance analysis of Operating System and IRIS metrics.
  • Allow a deeper dive by creating ad-hoc charts and by creating charts combining the Operating System and IRIS metrics with the "Pretty Performance" option.
  • The "System Overview" option saves you from searching your SystemPerformance files for system details or common configuration options.

YASPE is written in Python and is available on GitHub as source code or for Docker containers at:


13 1
5 725

Like hardware hosts, virtual hosts in public and private clouds can develop resource bottlenecks as workloads increase. If you are using and managing InterSystems IRIS instances deployed in public or private clouds, you may have encountered a situation in which addressing performance or other issues requires increasing the capacity of an instance's host (that is, vertically scaling).

5 1
0 472

Dynamic PoolSize (DPS) Experiment

Purpose:

Enhance Ensemble or IRIS production so it can dynamically allocate pool size for adapter-based components based on their utilization.

Sometimes, an unexpected traffic volume occurs, and default pool size allocated to production components may become a bottleneck. To avoid such situations, I created a demonstrator project some 2 years ago to see, whether it would be possible and feasible to modify production, so it allowed for dynamically modifying its components per their load.

5 3
0 535

A More Industrial-Looking Global Storage Scheme

In the first article in this series, we looked at the entity–attribute–value (EAV) model in relational databases, and took a look at the pros and cons of storing those entities, attributes and values in tables. We learned that, despite the benefits of this approach in terms of flexibility, there are some real disadvantages, in particular a basic mismatch between the logical structure of the data and its physical storage, which causes various difficulties.

2 0
0 880

Introduction

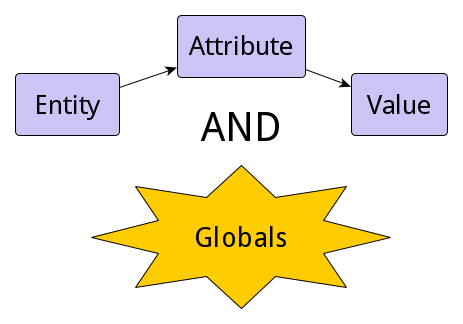
In the first article in this series, we’ll take a look at the entity–attribute–value (EAV) model in relational databases to see how it’s used and what it’s good for. Then we'll compare the EAV model concepts to globals.

3 0
4 4.1K

While reviewing our documentation for our ^pButtons (in IRIS renamed as ^SystemPerformance) performance monitoring utility, a customer told me: "I understand all of this, but I wish it could be simpler… easier to define profiles, manage them etc.".

After this session I thought it would be a nice exercise to try and provide some easier human interface for this.

The first step in this was to wrap a class-based API to the existing pButtons routine.

I was also able to add some more "features" like showing what profiles are currently running, their time remaining to run, previously running processes and more.

The next step was to add on top of this API, a REST API class.

With this artifact (a pButtons REST API) in hand, one can go ahead and build a modern UI on top of that.

For example -

6 15
4 1.2K

Introduction

InterSystems has recently completed a performance and scalability benchmark of IRIS for Health 2020.1, focusing on HL7 version 2 interoperability. This article describes the observed throughput for various workloads, and also provides general configuration and sizing guidelines for systems where IRIS for Health is used as an interoperability engine for HL7v2 messaging.

6 3
4 1.8K