Enjoy checking InterSystems IRIS performance with a useful tool ^mypButtons
[Background]
InterSystems IRIS family has a nice utility ^SystemPerformance (as known as ^pButtons in Caché and Ensemble) which outputs the database performance information into a readable HTML file. When you run ^SystemPerformance on IRIS for Windows, a HTML file is created where both our own performance log mgstat and Windows performance log are included.
^SystemPeformance generates a great report, however, you need to extract log sections manually from a HTML file and paste them to a spreadsheet editor like Excel to create a performance visual graph. Many developers already share useful tips and utilities to do it here (This is a Developer Community great article by @Murray Oldfield )
Now I introduce a new utiltiy ^mypButtons!
[What's new compared to other tools]
Download mypButtons.mac from OpenExchange.
- ^mypButtons combines mgstat and Windows performnace logs in one line. For instance, you can create a graph includes both "PhyWrs" (mgstat) and "Disk Writes/sec" (Win perfmon) in the same time frame.
- ^mypButtons reads multiple HTML files at once and generates a single combined CSV file.
- ^mypButtons generates a single CSV file into your laptop so it's much easier to crete your graph as you like.
- ^mypButtons generates a CSV and it includes columns which I strongly recommend to check as the first step to see the performance of InterSystems product. So everyone can enjoy a peformance graph with this utility so easily!
Please Note! If you want to play mypButtons.csv, please load SystemPerformance HTML files with "every 1 second" profile.
[How to run]
do readone^mypButtons("C:\temp\dir\myserver_IRIS_20230522_130000_8hours.html","^||naka")It reads one SystemPerformance HTML file and store the information into a given global. In this sample, it reads myserver_IRIS_20230522_130000_8hours.html and store it into ^||naka.
do readdir^mypButtons("C:\temp\dir","^||naka")It reads all of SystemPerformance HTML files under a given folder and store the information into a given global. In this sample, it reads all HTML files under C:\temp\dir and store it into ^||naka.
do writecsv^mypButtons("C:\temp\csv","^||naka")It generates the following three csv files under a given folder from a given global.
- mgstat.csv
- perfmon.csv
- mypButtons.csv
Here, mypButtons.csv includes the following columns by default, which I strongly recommend to check first to see the performance:
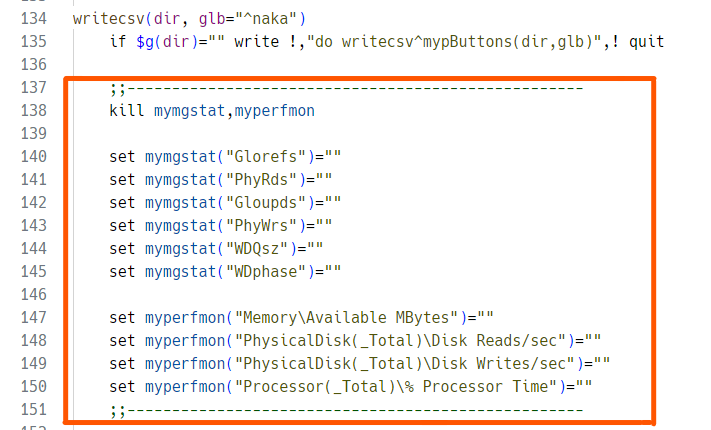
- mgstat: Glorefs, PhyRds, Gloupds, PhyWrs, WDQsz, WDphase
- perfmon: Available MBytes, Disk Reads/sec, Disk Writes/sec, % Processor Time
This utility works for InterSystems IRIS, InterSystems IRIS for Health, Caché and Ensemble for Windows.
[Example steps to create your IRIS server's performance graph with ^mypButtons]
(1) First, run ^SystemPerformance to record both our own performance tool mgstat and Windows peformance monitor perfmon. By default, InterSystems IRIS has some profiles so you can enjoy it soon. Try this from IRIS terminal.
%SYS> do ^SystemPerformance
Current log directory: c:\intersystems\iris\mgr\
Windows Perfmon data will be left in raw format.
Available profiles:
  1 12hours - 12-hour run sampling every 10 seconds
  2 24hours - 24-hour run sampling every 10 seconds
  3 30mins - 30-minute run sampling every 1 second
  4 4hours - 4-hour run sampling every 5 seconds
  5 8hours - 8-hour run sampling every 10 seconds
  6 test - 5-minute TEST run sampling every 30 seconds
select profile number to run: 3
Please Note! If you want to play mypButtons.csv, please use "every 1 second" profile. By default, you will see "30 mins" profile which samples every 1 second. If you want to create another profiles, see our documentation for more details.
(2) After sampling, one HTML will be generated under irisdir\mgr, whose name is like JP7320NAKAHASH_IRIS_20231115_100708_30mins.html. Open a generated HTML, and you will see a lot of performance comma separated data under mgstat and perfmon section.

(3) Load it with ^mypButtons as below.
USER> do readone^mypButtons("C:\InterSystems\IRIS\mgr\JP7320NAKAHASH_IRIS_20231115_100708_30mins.html","^||naka")This will load HTML in the first parameter and save the performance data into the global in the second parameter.
(4) Generate CSV witl ^mypButtons as below.
USER> do writecsv^mypButtons("C:\temp","^||naka")This will output three CSV files under the folder in the first parameter from the global in the second parameter. Open mypButtons.csv in the excel, and you can see mgstat and perfmon is in the same line every second. See this screenshot - yellow highlighted columns are mgstat and blue highlighted columns are perfmon.

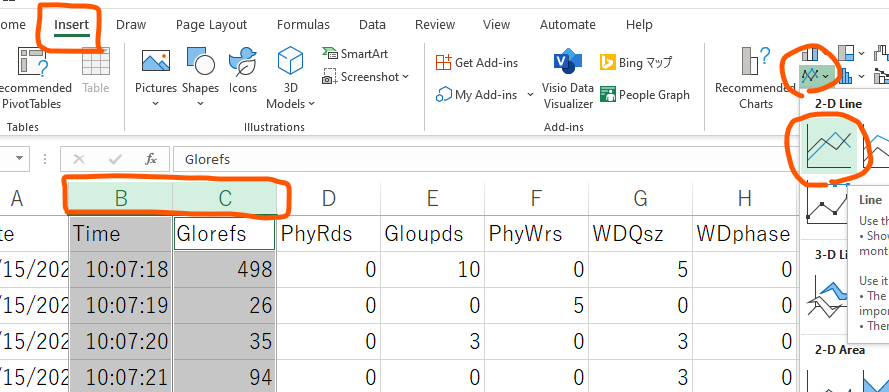
(5) Let's create a simple graph from this CSV. It's so easy. Choose column B Time and column C Glorefs, select Insert menu, 2-D Line graphs as below.

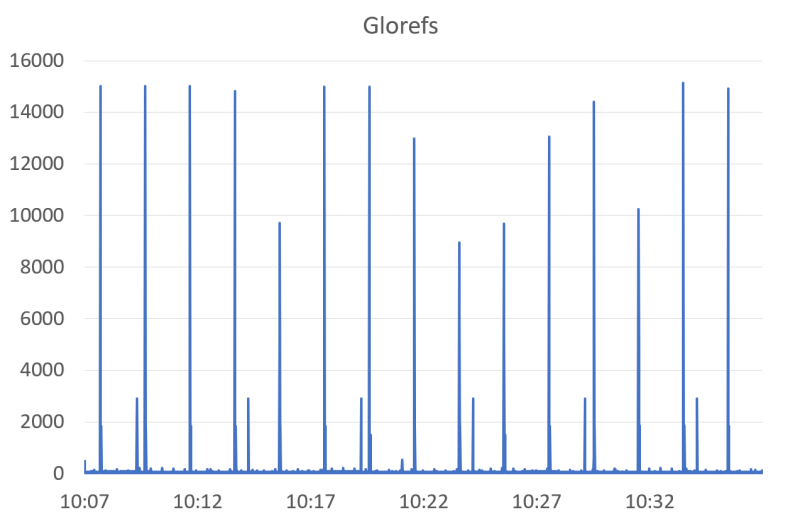
This graph will show you "Global Refernce numbers per second" information. Sorry, there were very few activities in my IRIS instance so my sample graph does not excite you, but I do believe this graph from the production server will tell you a lot of useful information!

(6) mypButtons.csv includes selected columns which I think you should check first. Murray's article series will tell you why these columns are important to see the performance.
[Edit ^mypButtons for reporting columns]
If you want to change columns which are reported into mypButtons.csv, please modify writecsv label manually. It reports columns which are defined in this area.

I hope my article and utility will make you encourage to check the performance of InterSystems IRIS. Happy SystemPeformance 😆
Comments
Very interesting starting point to understand how to collect performance informations.
💡 This article is considered InterSystems Data Platform Best Practice.