OpenTelemetry Traces from IRIS implemented SOAP Web Services
A customer recently asked if IRIS supported OpenTelemetry as they where seeking to measure the time that IRIS implemented SOAP Services take to complete. The customer already has several other technologies that support OpenTelemetry for process tracing. At this time, InterSystems IRIS (IRIS) do not natively support OpenTelemetry.
It's fair to say that IRIS data platform has several ways to capture, log and analyse the performance of a running instance, this information does not flow out of IRIS through to other opentelemetry components like Agents or Collectors within an implemented OpenTelemetry architecture. Several technologies already support OpenTelemetry which seems to bet becoming a defacto standard for Observability.
Whilst there is ongoing development to natively support this capability in future IRIS releases, this article explains how, with the help of the Embedded Python and the corresponding Python libraries, IRIS application developers can start publishing Trace events to your OpenTelemetry back-ends with minimal effort. More importantly, this gives my customer something to get up and running with today.
Observability.
Observability in generally comprises three main aspects:
- Metrics capture, which is the capture of quantitative measuremements about the performance and behaviour of a system, similar to what IRIS publishes via its /api/monitor/metrics api
- Logging, which involves capturing and storing relevant information generated by an application or system, such as what appears in System Log outputs, or messages.log file generated by IRIS instances.
- Tracing: which involves tracking the flow of a service request or transaction as it moves through various components of a solution. Distributed tracing allows you to follow the path of a request across multiple services, providing a visual representation of the entire transaction flow.
This article and accompanying application found here, focuses solely on Tracing of SOAP Services.
In this implementation which is only using IRIS as the technology to generate telemetry, a Trace and root Span is started when the SOAP Service is started.
Approach for implementation:
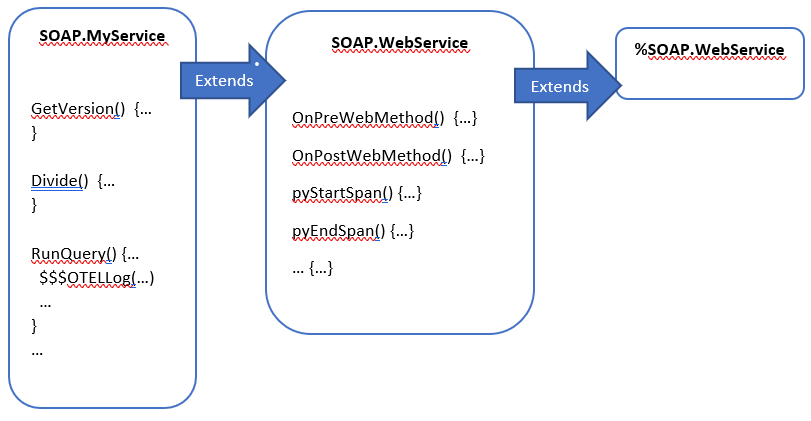
Subclass IRIS's %SOAP.WebService class with OpenTelemetry implementation logic and Python library functions in a new calss called SOAP.WebService. Include Macros that can be used in user code to further contribute to observability and tracing. Minimal changes to the existing SOAP implementation should be needed (replace use of %SOAP.WebService with SOAP.WebService as the Web Service superclass for implementing SOAP.
The diagram below illustrates this approach:
Features of this implementation:
- By default, every SOAP Service will be tracked and reports trace information.
- When a SOAP Service is used for the first time, the implementation will initalise an OpenTelemetry Tracer object. A combination of the IRIS Server name and Instance is provided as the telemetry source, and, the SOAP Action used as th name for the default root span tracking the soap service.
- Telemetry traces and the default span will be automatically closed when the SOAP method call ends
- Upon creation, Key/Value pairs of attributes can be added to the default root span, such as, CSP Session ID, or Job number
- Users may use the $$$OTELLog(...), to add an arbitratry manual logging into a span, using a simple string or array of key valye pairs
- Users may use the $$$OTELPushChildSpan(...)/$$$OTELPopChildSpan(...) to create non-root spans around sections of code which they want to independantly identify with their logic
Installation and testing
- Clone/git pull the repo into any local directory
$ git clone https://github.com/pisani/opentelemetry-trace-soap.git- Open a terminal window in this directory and type the following to build the IRIS images with sample code:
$ docker-compose build- Once the iris image is build, in the same directory type the following to start up the Jaeger and IRIS containers:
$ docker-compose up -dThis will startup two containers - the Jaeger OpenTelemetry target backend container (also exposing a user interface), and, an instance of IRIS which will serve as the SOAP Web Services server endpoint. Three simple webservices have been developed in the IRIS instance for testing the solution.
- Using your browser access the SOAP Information and testing pages via this URL. logging in as superuser/SYS if prompted:
http://localhost:52773/csp/irisapp/SOAP.MyService.cls
(Note: These pages are not enabled by default and security within the running IRIS instance had to be relaxed to enable this feature, for ease of testing)
.png)
Select each of the web methods you want to test, in order to generate SOAP activity. To see this implementation generate an Error in the observed traces, use zero (0) as the second number in the Divide() SOAP method in order to force a <DIVDE> error.
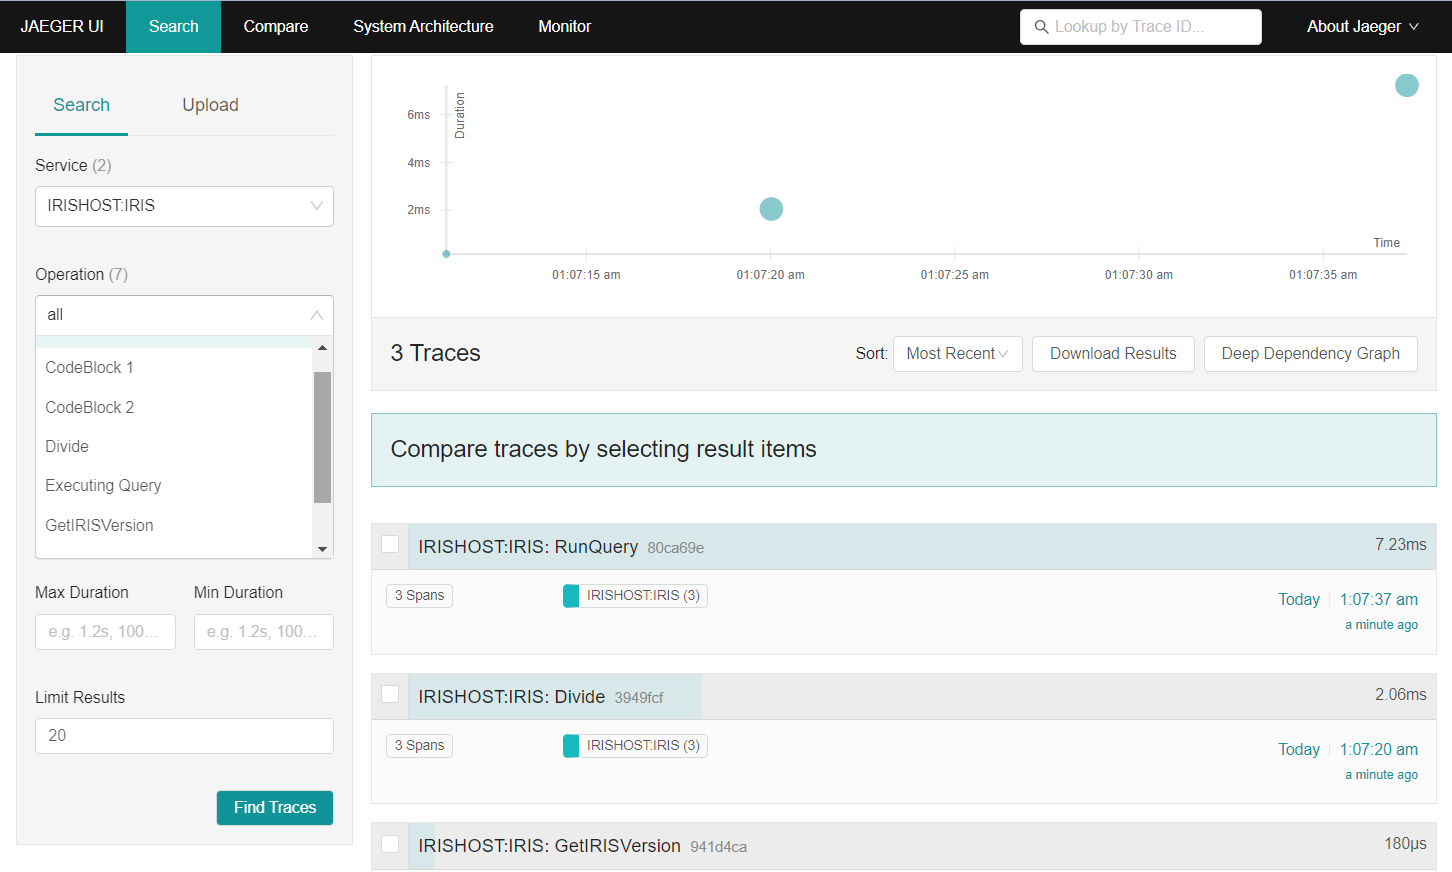
- Open another browser tab pull up the Jaeger UI via the following URL
http://localhost:16686
- The resulting landing page shows you all services contributing telemetry readings and should look something similar to the screenshot below:
Conclusion
In summary, this article demonstrates how Embedded Python, could be used to add additional features to IRIS, in my case, to implement Observability tracing for SOAP services. The options available via Python and IRIS's ability to leverage these Python libraries is truely.
I recognise that work can be undertaken to create a more generic OpenTelemetrySupport class that implements the same for REST services, as well as extending current Class Method signatures to tracking timing of any Class method through this framework.
Comments
Thanks @Steve Pisani - a good overview for an important topic.
Fantastic write up @Steve Pisani , thank you.
Great article @Steve Pisani! You stole my idea of showcasing Jaeger and IRIS... oh well, I'll send people over to this article.
Also, thanks to @Ron Sweeney ;-)
@well done @Steve Pisani, thank you :)
💡 This article is considered InterSystems Data Platform Best Practice.