AWS storage. High write IOPS. Compare gp3 and io2.
Most transactional applications have a 70:30 RW profile. However, some special cases have extremely high write IO profiles.
I ran storage IO tests in the ap-southeast-2 (Sydney) AWS region to simulate IRIS database IO patterns and throughput similar to a very high write rate application.
The test aimed to determine whether the EC2 instance types and EBS volume types available in the AWS Australian regions will support the high IO rates and throughput required.
Minimal tuning was done in the operating system or IRIS (see Operating System and IRIS configuration below).
- The EC2 instance and EBS volume types were selected to maximise IOPS and throughput.
The following tests were run:
- Using a single io2 Block Express volumes each for database and WIJ.
- Using a Logical Volume Manager (LVM) striped volume of 16 gp3 disks for the database and a five gp3 disk LVM striped volume for the WIJ.
- Two instances in separate availability zones using IRIS synchronous database mirroring using a single io2 Block Express volume for the database and WIJ on each instance.
Summary
A limited number of tests were run. However, the results show that running a high IO rate IRIS workload in the Sydney AWS region is possible.
There are limits everywhere in the cloud
- It is worth noting that along with the published IOPS and throughput limits for instances and storage, AWS has limits at the account level. AWS was required to lift InterSystems account regional default IOPS quotas to enable testing at high IO rates—specifically, EBS - IOPS for Provisioned IOPS SSD (io2) volumes to 600,000.
- Remember to review limits before starting its tests, especially mirroring tests, as all volumes in the region are included in the same total.
EBS Volume Types
- IO Tests were run with the IRIS database using a single EBS io2 Block Express volume and multiple (16) EBS gp3 volumes using Logical Volume Manager (LVM).
- The database write IOPS, throughput, and latency were similar between the io2 Block Express and gp3 LVM tests. Database write latency was around 1 ms.
- The read latency of gp3 was two times io2 Block Express. However, the gp3 maximum read latency was still acceptable at less than 0.8 ms.
- WIJ write latency was around 50% higher on a single io2 Block Express volume than on a five-volume gp3 LVM stripe.
- For details on io2 Block Express, see https://aws.amazon.com/ebs/provisioned-iops/.
- For details on gp3, see https://aws.amazon.com/ebs/general-purpose/.
EC2 Instance Types
- At the time of testing in July 2023, only one EC2 memory-optimised instance type (r5b) in the Sydney region uses the nitro system capable of running io2 Block Express volumes.
- The EC2 instance type selected must be capable of matching or exceeding the storage IO and throughput needed for the data and WIJ volumes.
- The only instance types in Sydney supporting the io2 Block Express are r5b and c7g. c7g was not used due to lower IOPS and low memory.
- io2 Block Express is required for higher throughput and IOPS (256,000 IOPS per volume) compared to standard io2 (64,000 IOPS per volume).
- EC2 instances capable of using io2 Block Express are not currently available in Melbourne.
The Tests
- The publicly available RANREAD and RANWRITE utilities were used to simulate the IRIS IO profile. For example, RANWRITE uses the IRIS WD cycle, resulting in a burst of large WIJ IOs and random database writes that are not usually expected or understood by storage vendors.
- For an overview of LVM, RANREAD, and RANWRITE utilities, see https://community.intersystems.com/post/using-lvm-stripe-increase-aws-ebs-iops-and-throughput.
- At higher IOPS and throughput, the overall results and IO profile are not expected to change; for example, there will be a longer WD cycle at peak storage IOPS at the observed latency.
AWS Environment
The following environment was tested in ap-southeast-2 (Sydney). The same instance type was used for all tests for an apples-to-apples comparison.
EC2 instance profile
EC2 instance type:
- R5b.24xlarge: 96 vCPU, 780 GB Memory, 25 Gbps network.
- EBS limits per EC2 instance:
- Maximum throughput (MB/s) 7,500
- Maximum IOPS 260,000
- EBS limits per EC2 instance:
The benchmark suite uses a 4MB LVM stripe whether there are single or multiple volumes. All volumes use the xfs filesystem.
Benchmark tests
- For test 1 and test 2, the WIJ is on a separate volume.
- The WIJ and database could be on the same volume to save on storage costs.
- However, having the WIJ on a separate volume isolates the impact of the WIJ on database reads.
- The journal volume is always separate from the WIJ and database volumes.
Test 1 - io2 Block Express
Storage layout
- Journal
- Single gp3 volume. I used the defaults: 3,000 IOPS and 125 MB/s throughput.
- WIJ
- Single io2 Block Express volume. 256,000 IOPS and 4,000 MB/s throughput.
- Database
- Single io2 Block Express volume. 100,000 IOPS and 4,000 MB/s throughput.
Test 2 - gp3 LVM stripe
Storage layout
- Journal
- Single gp3 volume. I used the defaults: 3,000 IOPS and 125 MB/s throughput.
- WIJ
- Five gp3 volumes. Each 16,000 IOPS and 1,000 MB/s throughput. Total 80,000 IOPS and 5,000 MB/s throughput.
- Database
- 16 gp3 volumes. Each 16,000 IOPS and 1,000 MB/s throughput. Total 256,000 IOPS and 16,000 MB/s throughput.
Test 3 - IRIS asynchronous database mirror - io2 Block Express
A database mirror was created with the primary mirror member in AWS availability zone b and the backup mirror member in availability zone c. The arbiter was in availability zone a.
- The same read/write IO rate was run as the other tests.
Storage layout
-
Due to the total 600,000 IOPS quota across all volumes, the WIJ and database are on the same io2 Block Express volume. Allowing a total of (256K + 256K) 512 IOPS across the mirrors.
-
Journal
- Single gp3 volume. I used the defaults: 3,000 IOPS and 125 MB/s throughput.
-
WIJ and Database
- Single io2 Block Express volume. 256,000 IOPS and 4,000 MB/s throughput.
Observations
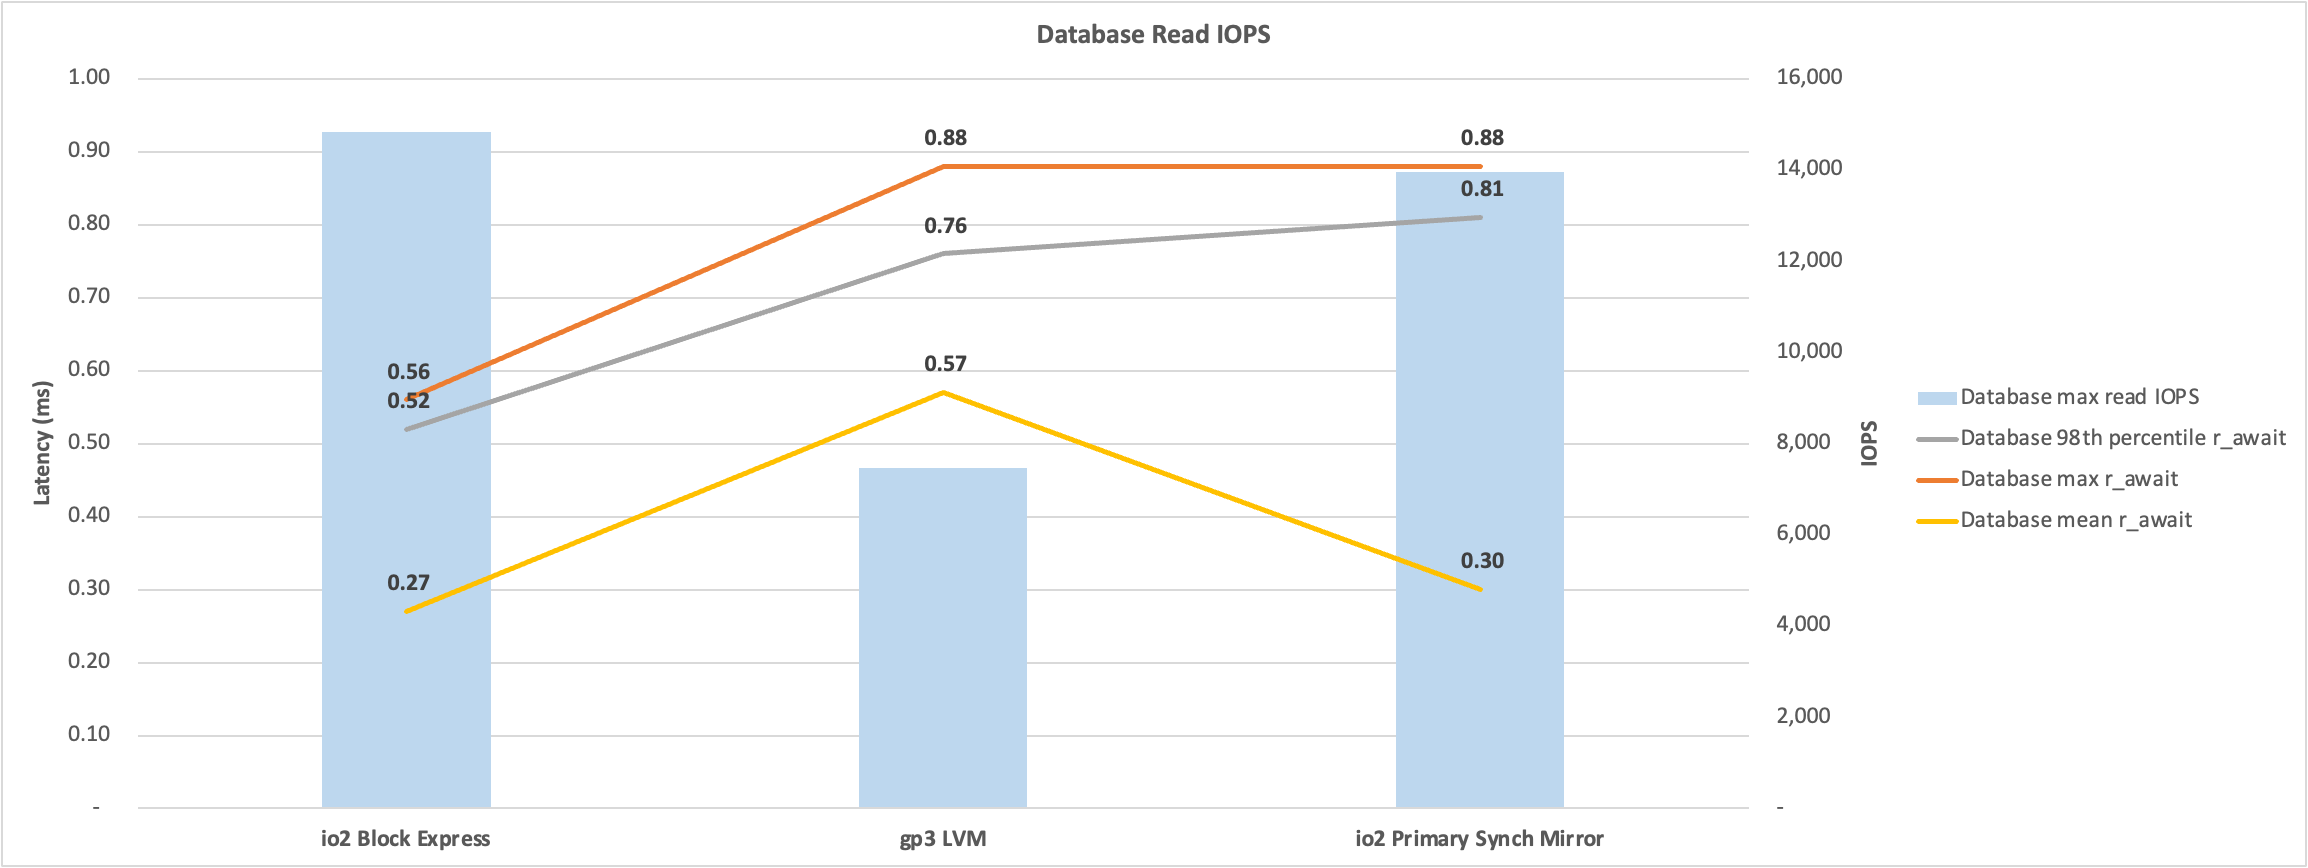
Database Read IO
The chart below shows io2 Block Express has approximately half the latency as an LVM stripe of gp3 volumes. The benchmark tests are paced using a set number of processes, with the result you get half the IOPS at twice the latency. An application-based test may provide different results, or the pace of the tests could be changed to increase the processes and resulting IOPS.
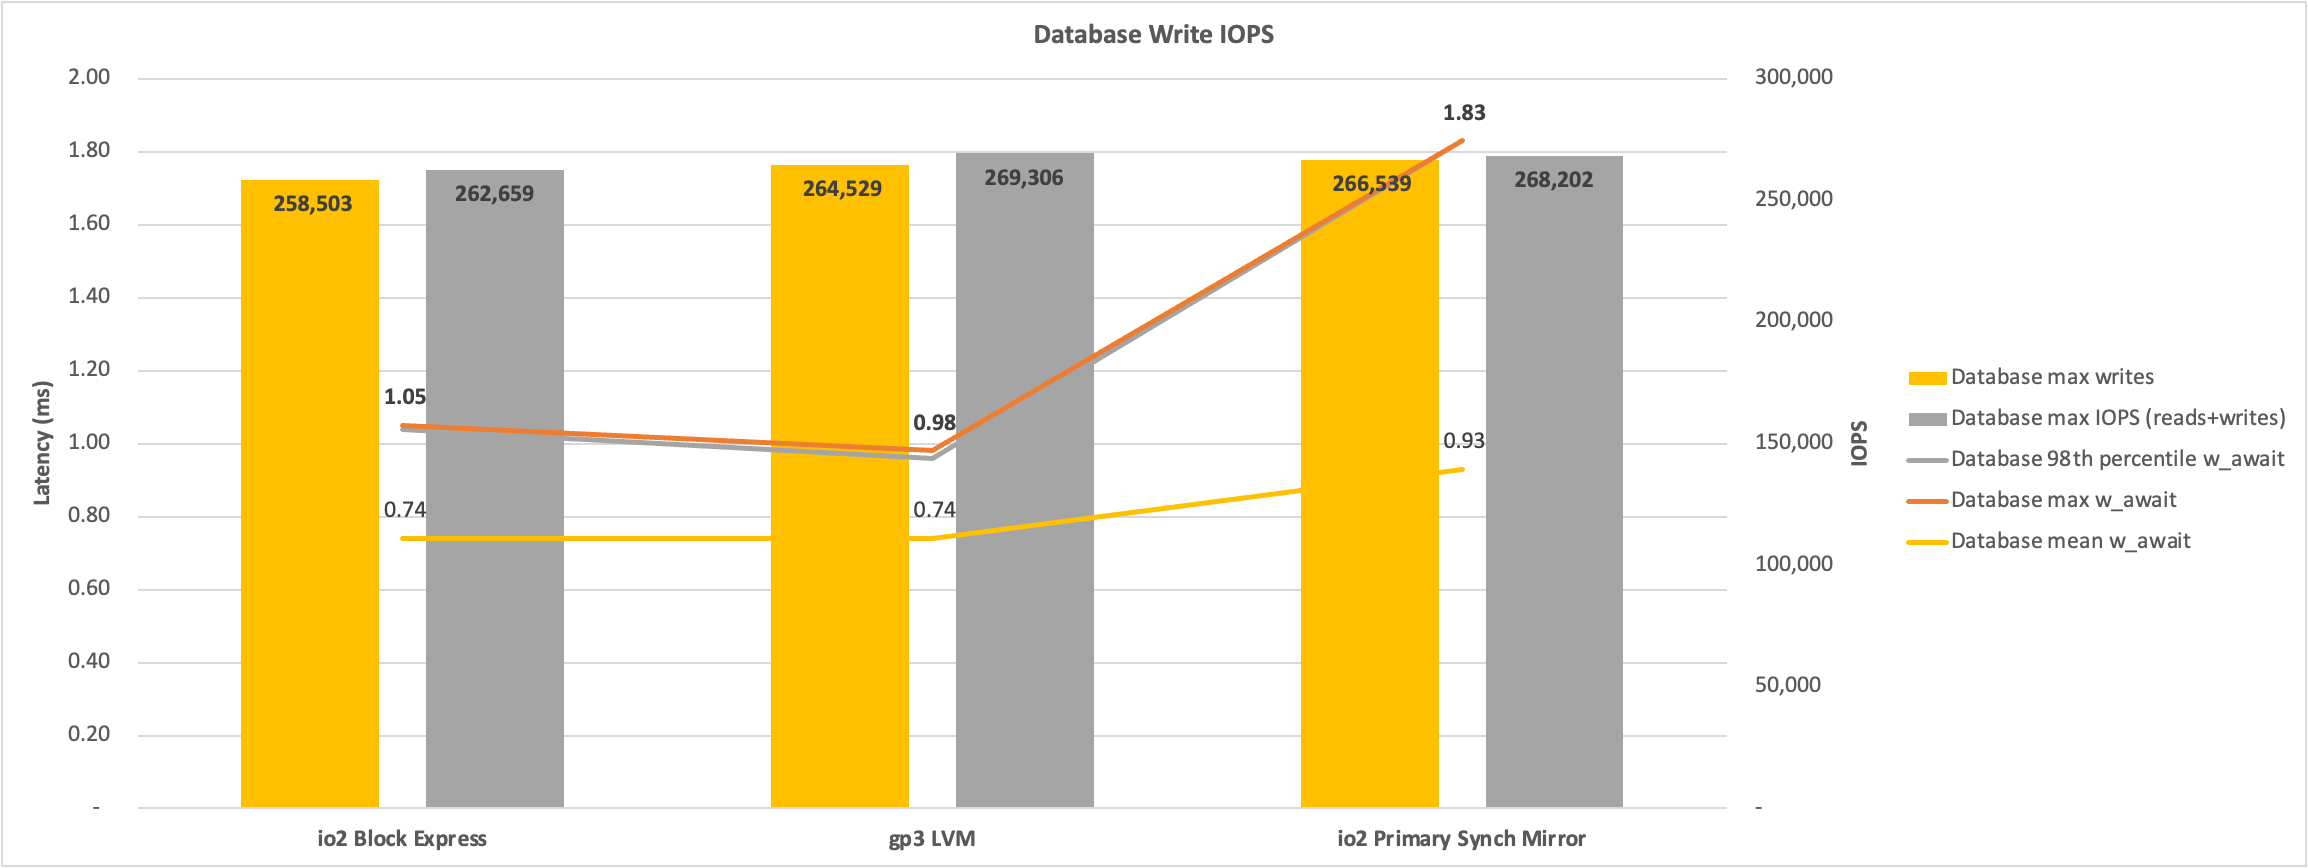
Database Write IO
The chart below shows similar peak IOPS and latency between io2 Block Express and an LVM stripe of gp3 volumes. The higher write latency of the Primary mirror database is because the WIJ is on the same volume, the higher latency is the WIJ, the random database writes latency was similar to io2 Block Express. Latency is measured for non-zero writes.
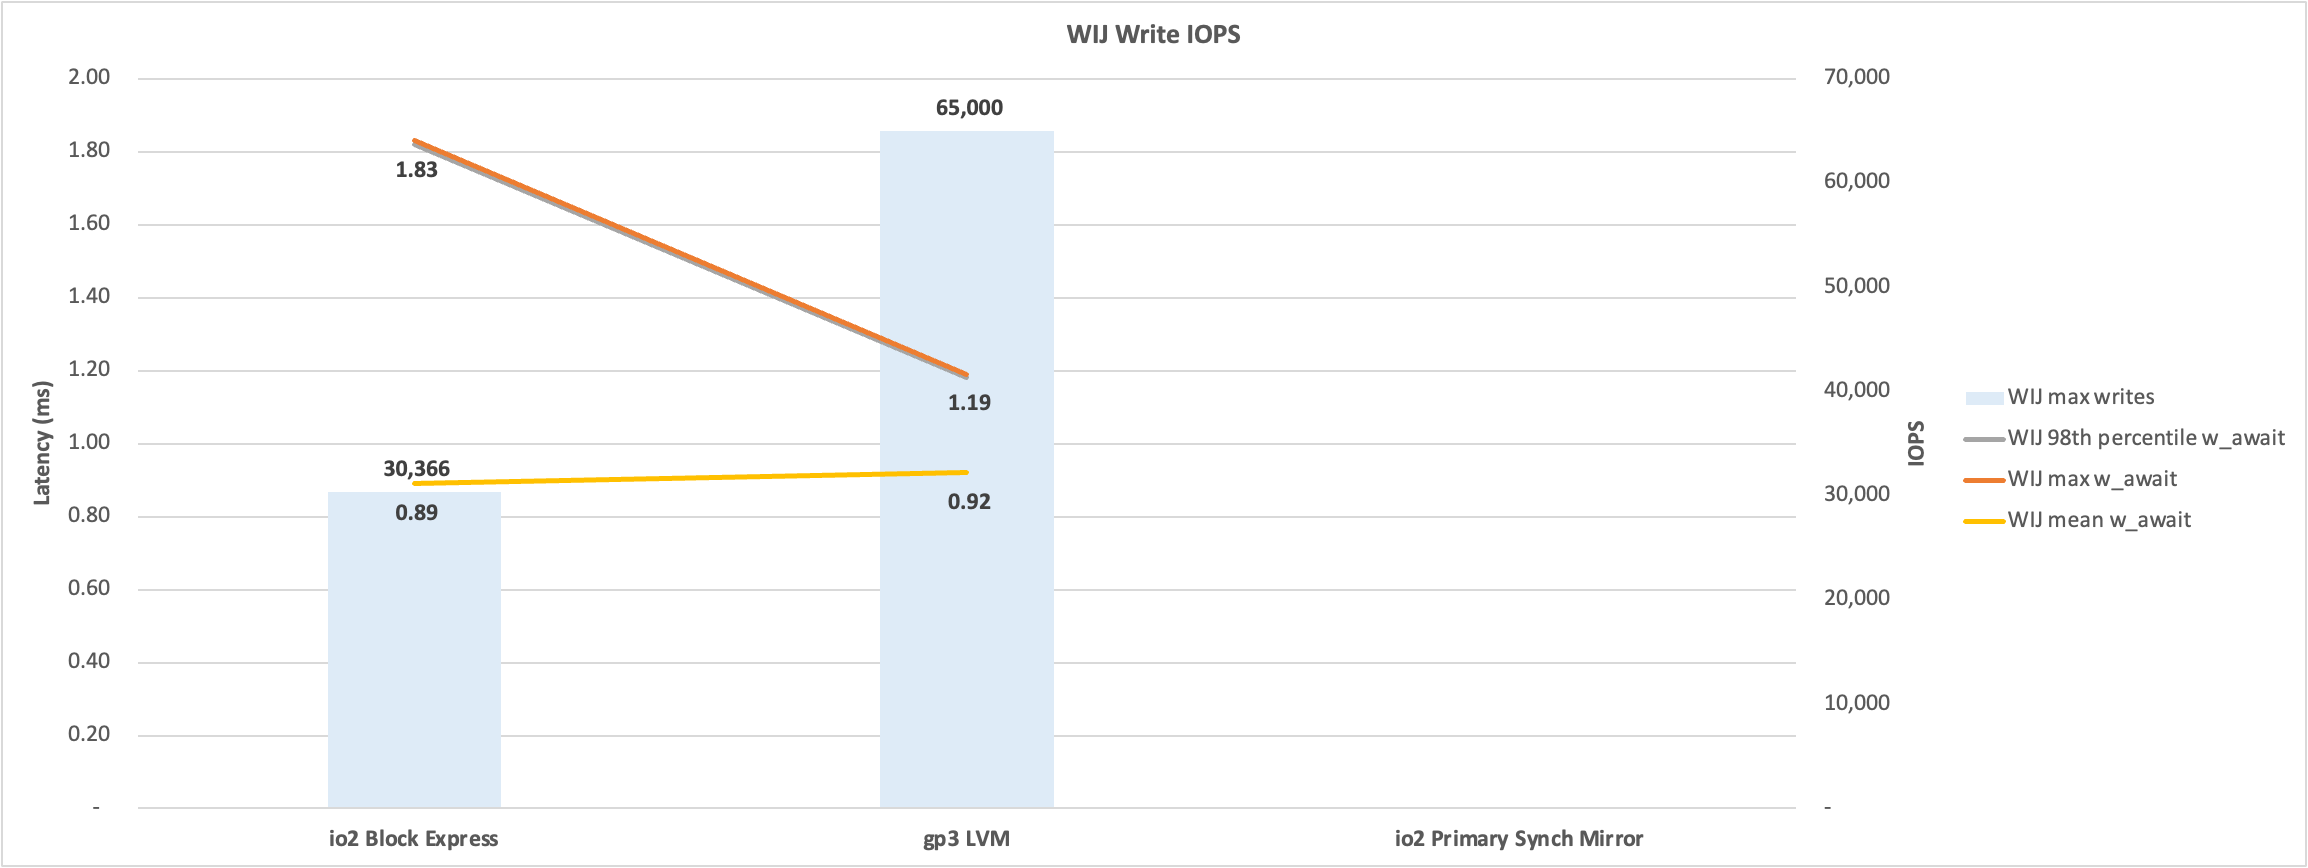
WIJ Write IO
The chart below shows higher throughput for an LVM stripe of gp3 volumes. However, this is misleading, as the io2 Block Express volume had higher throughput and a shorter WIJ write time. Further investigation may show, for example, larger IOs on the io2 Block Express volume. Latency is measured for non-zero writes.
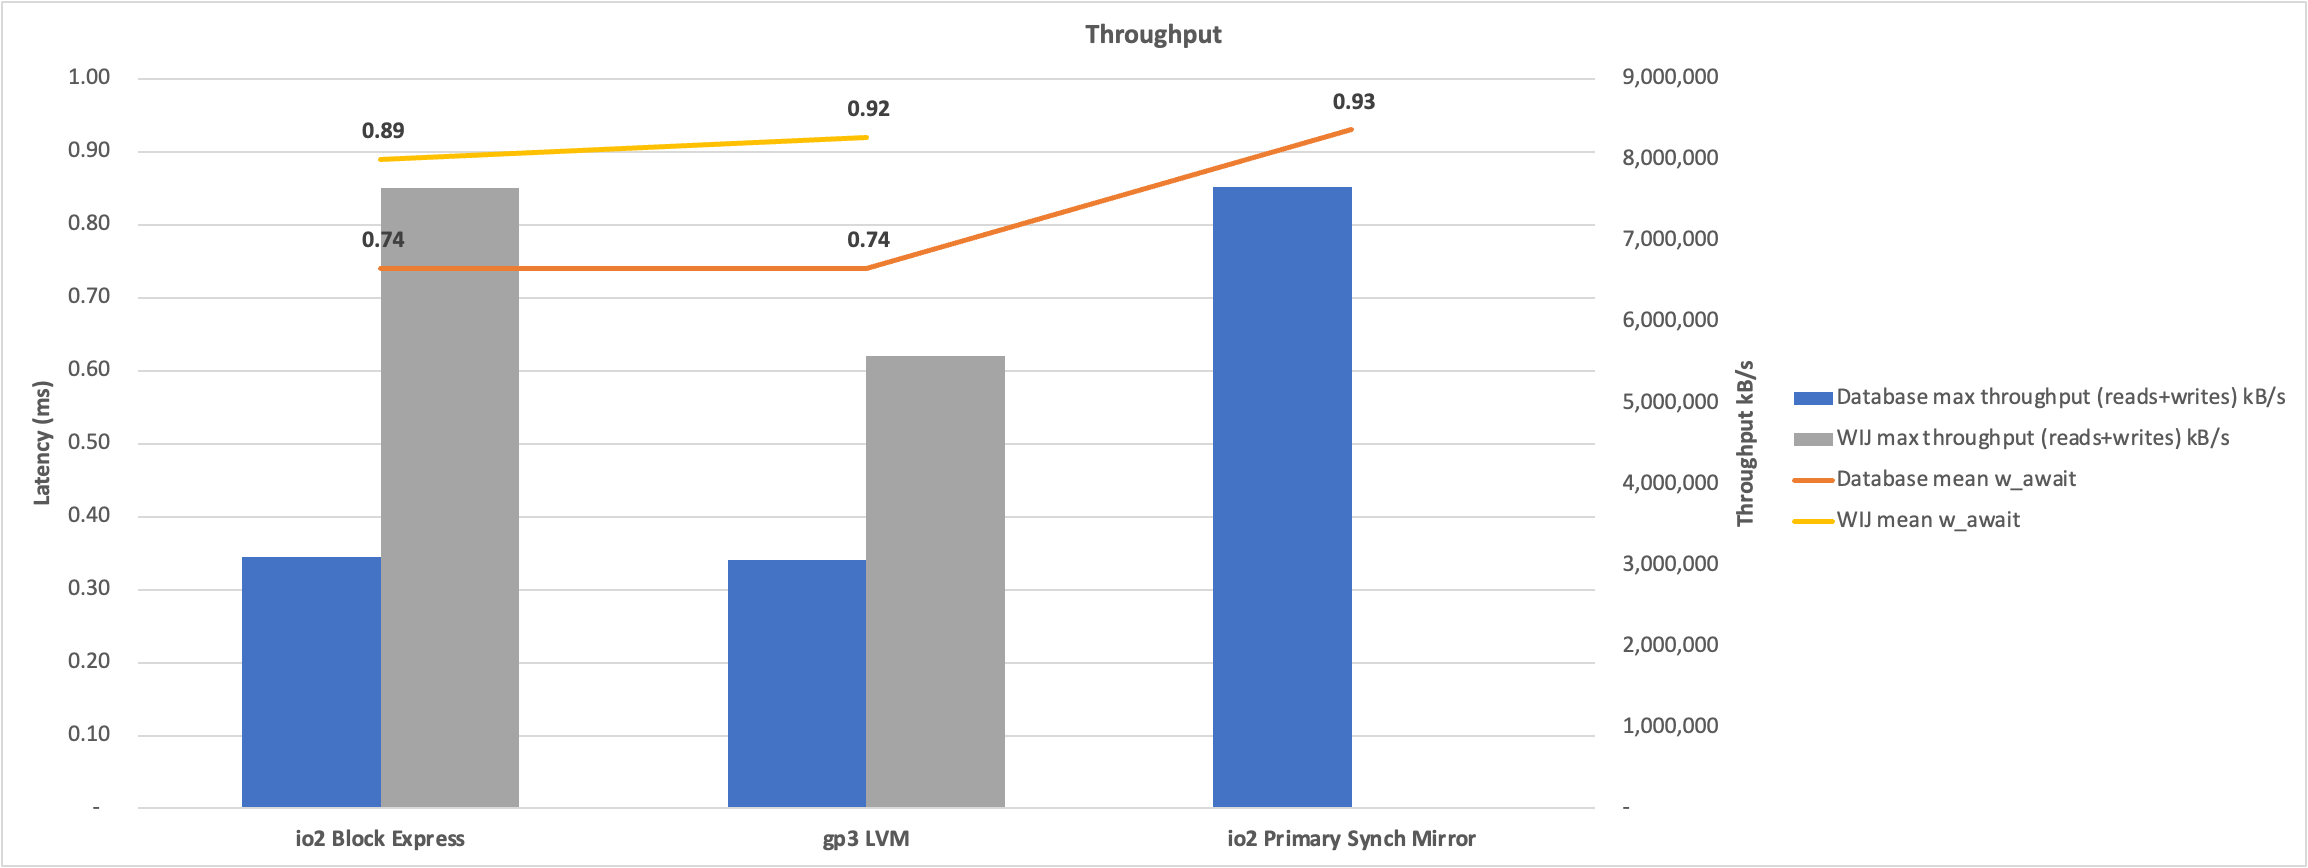
Throughput
Throughput is one of the metrics AWS charges for and is a metric that has a maximum per EC2 instance (10,000 MB/s) and per EBS volume (4,000 MB/s for io2 Block Express and 1,000 MB/s for gp3). Similar to the way IOPS are monitored and throttled by AWS by increasing latency. The following chart shows the kB/s throughput. The throughput requirements must be known to ensure that under-provisioning throughput does not become a bottleneck. The WIJ throughput is higher than the provisioned throughput per volume; this can happen as AWS takes a few seconds to register that higher than provisioned IOPS or throughput is occurring before limiting.
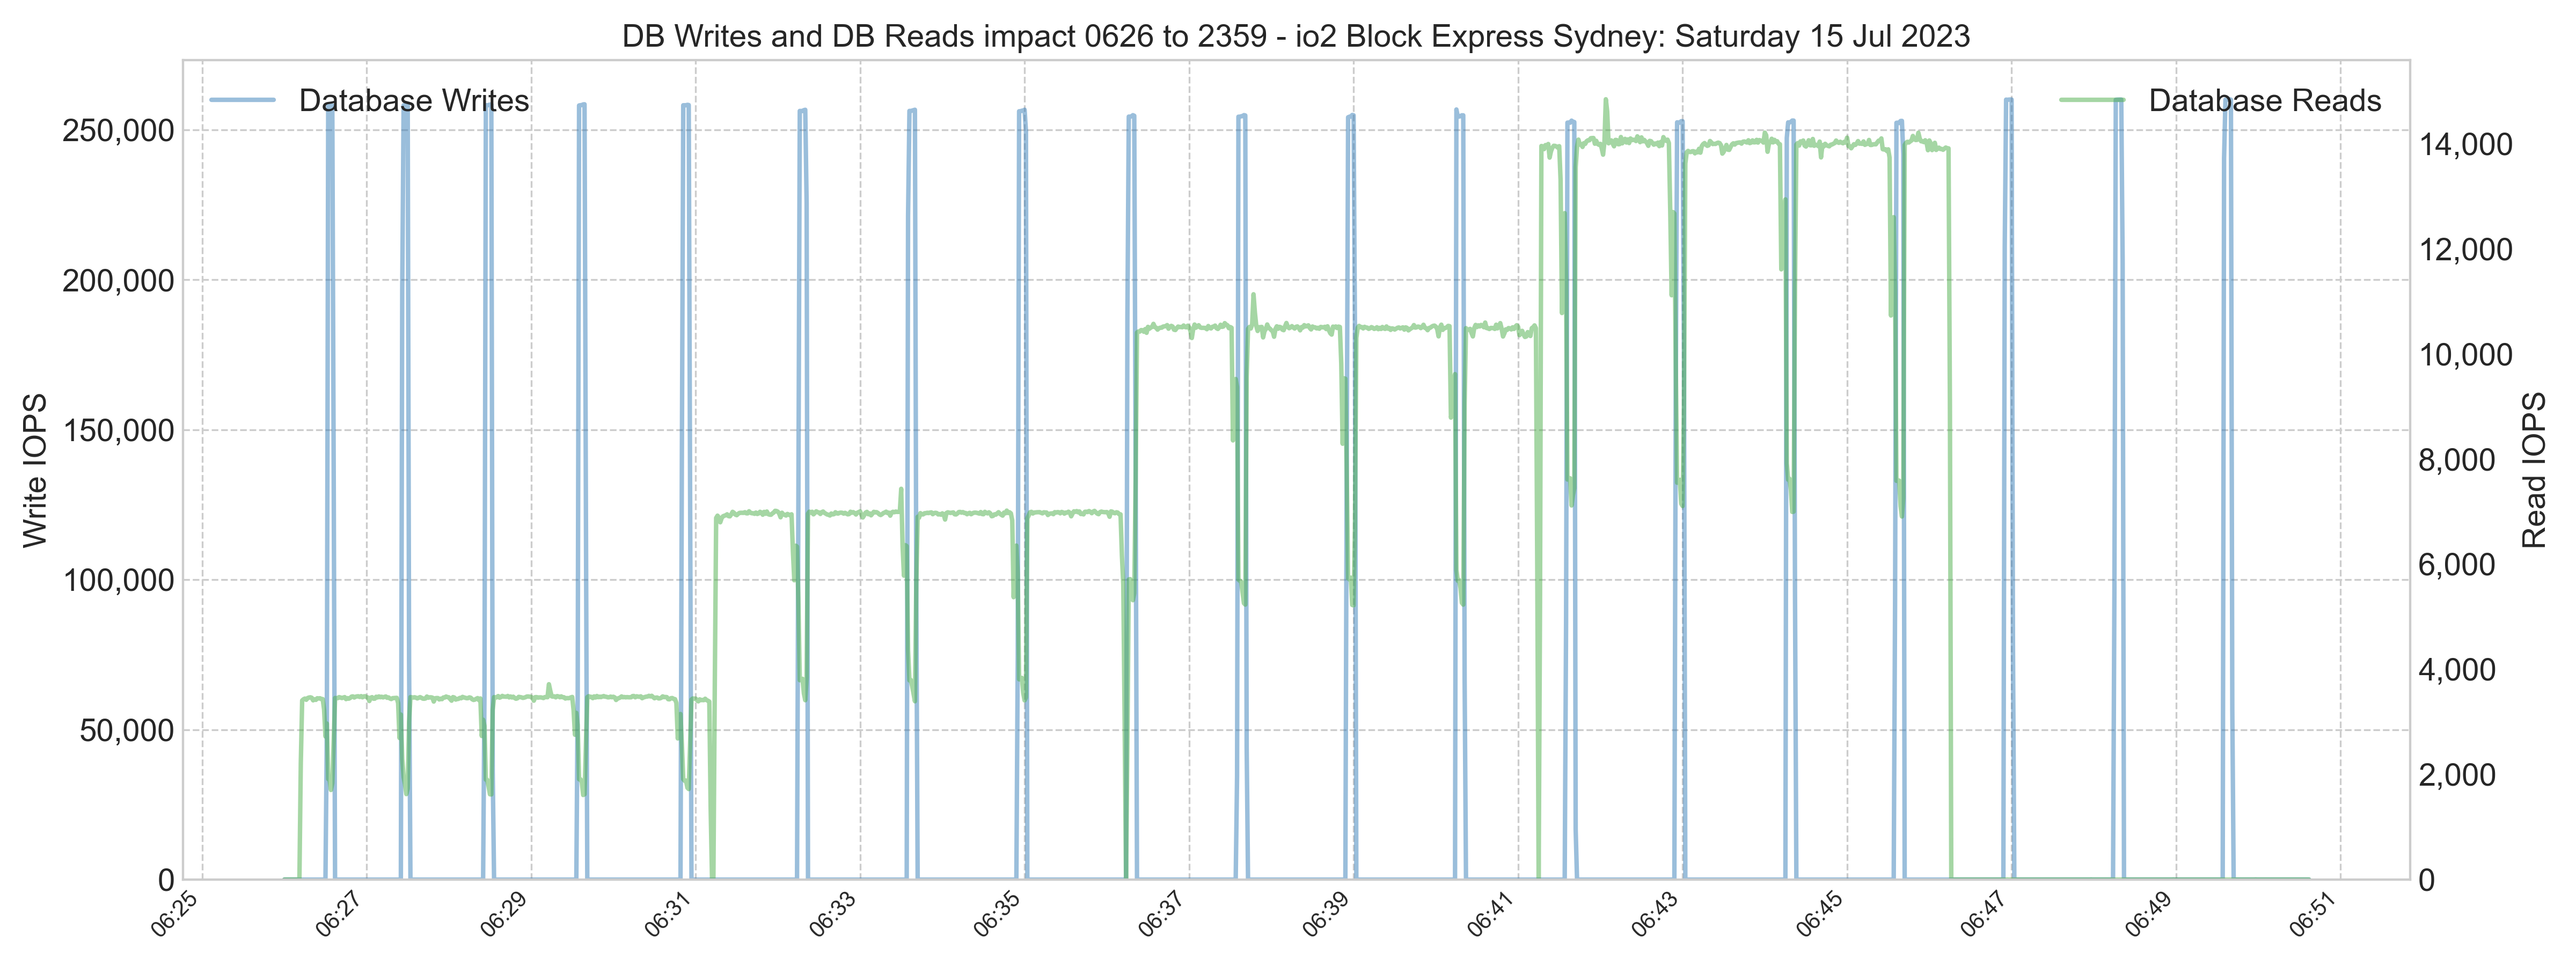
Database writes impact on database read latency.
The charts show the trends. However, many details will come out by examining the metrics more closely. For example, database reads are impacted by a burst of writes on the same volume. The larger-sized writes of the WIJ have a more significant impact. The io patterns of the different volume types are interesting as well.
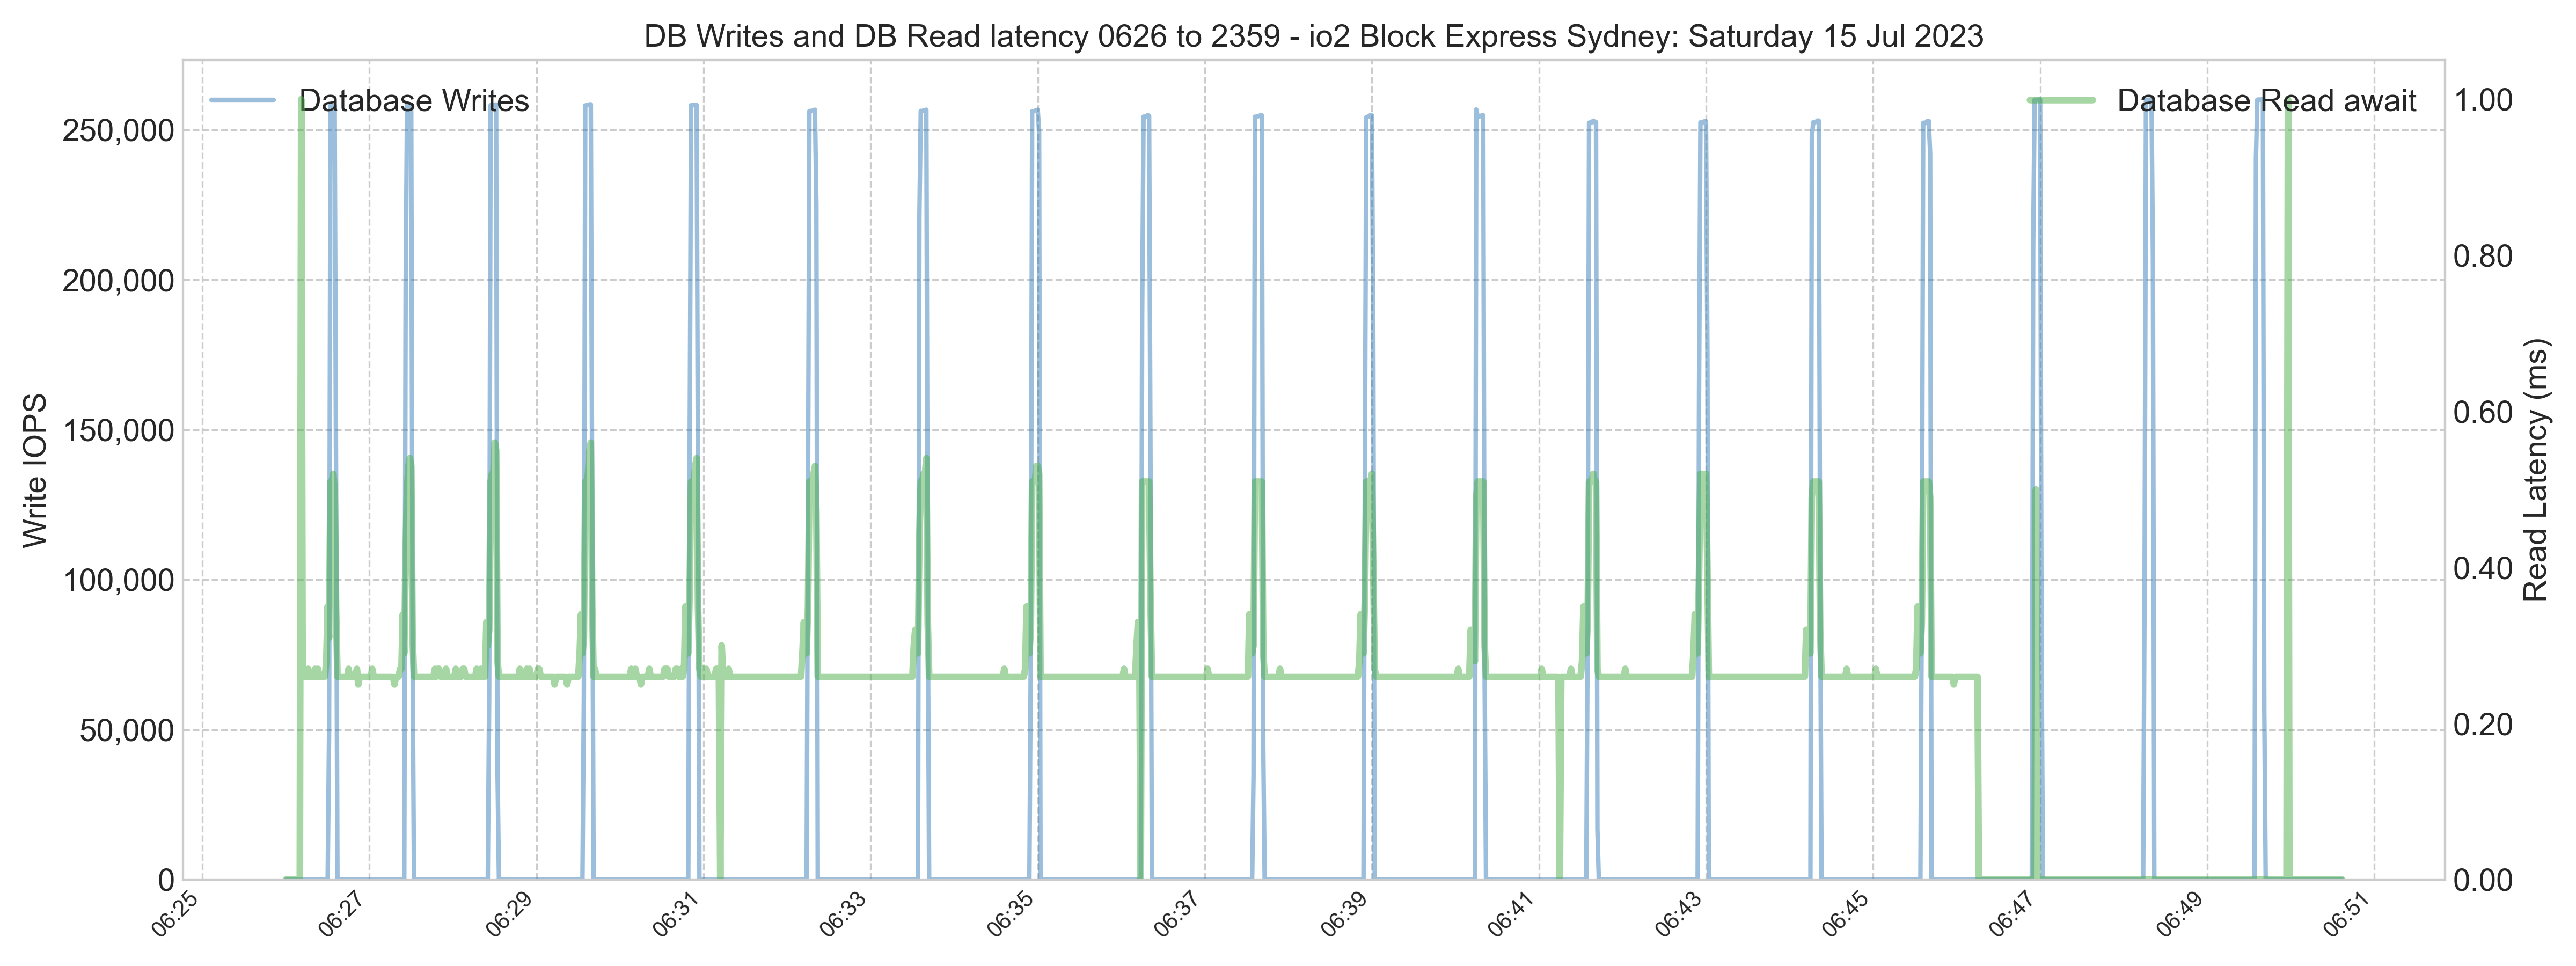
io2 Block Express
The following chart shows the stepped increases in the read process during the io2 Block Express test. Note the dip in reads when the storage has to read and write simultaneously.
The following chart shows the corresponding spikes in latency. Note the smooth read IOPS in the chart above and the flat latency below.
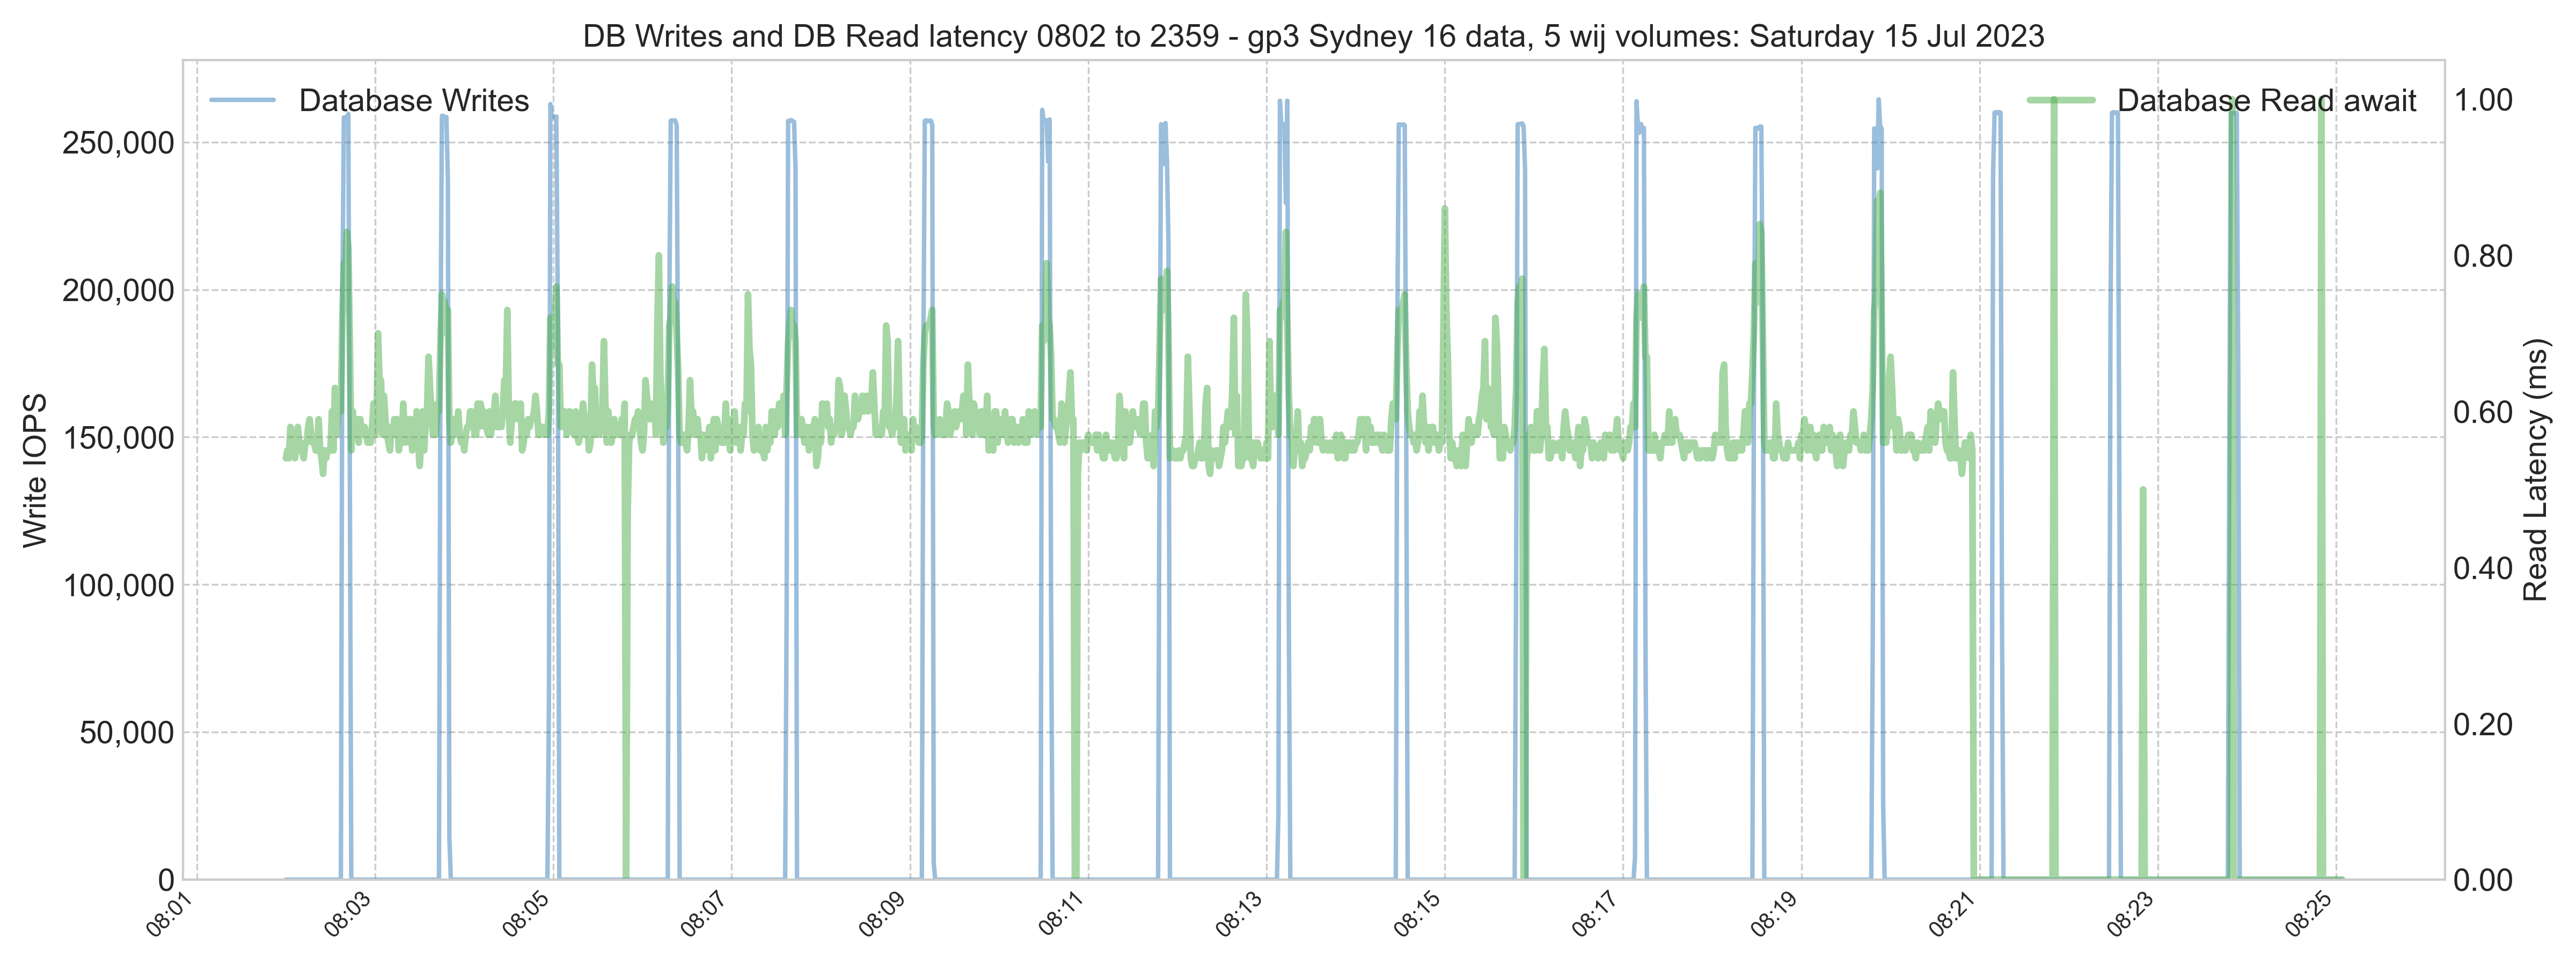
gp3 LVM stripe
The same charts for the LVM stripe of gp3 disks show the less stable io pattern (sometimes called jitter) of gp3 disks.
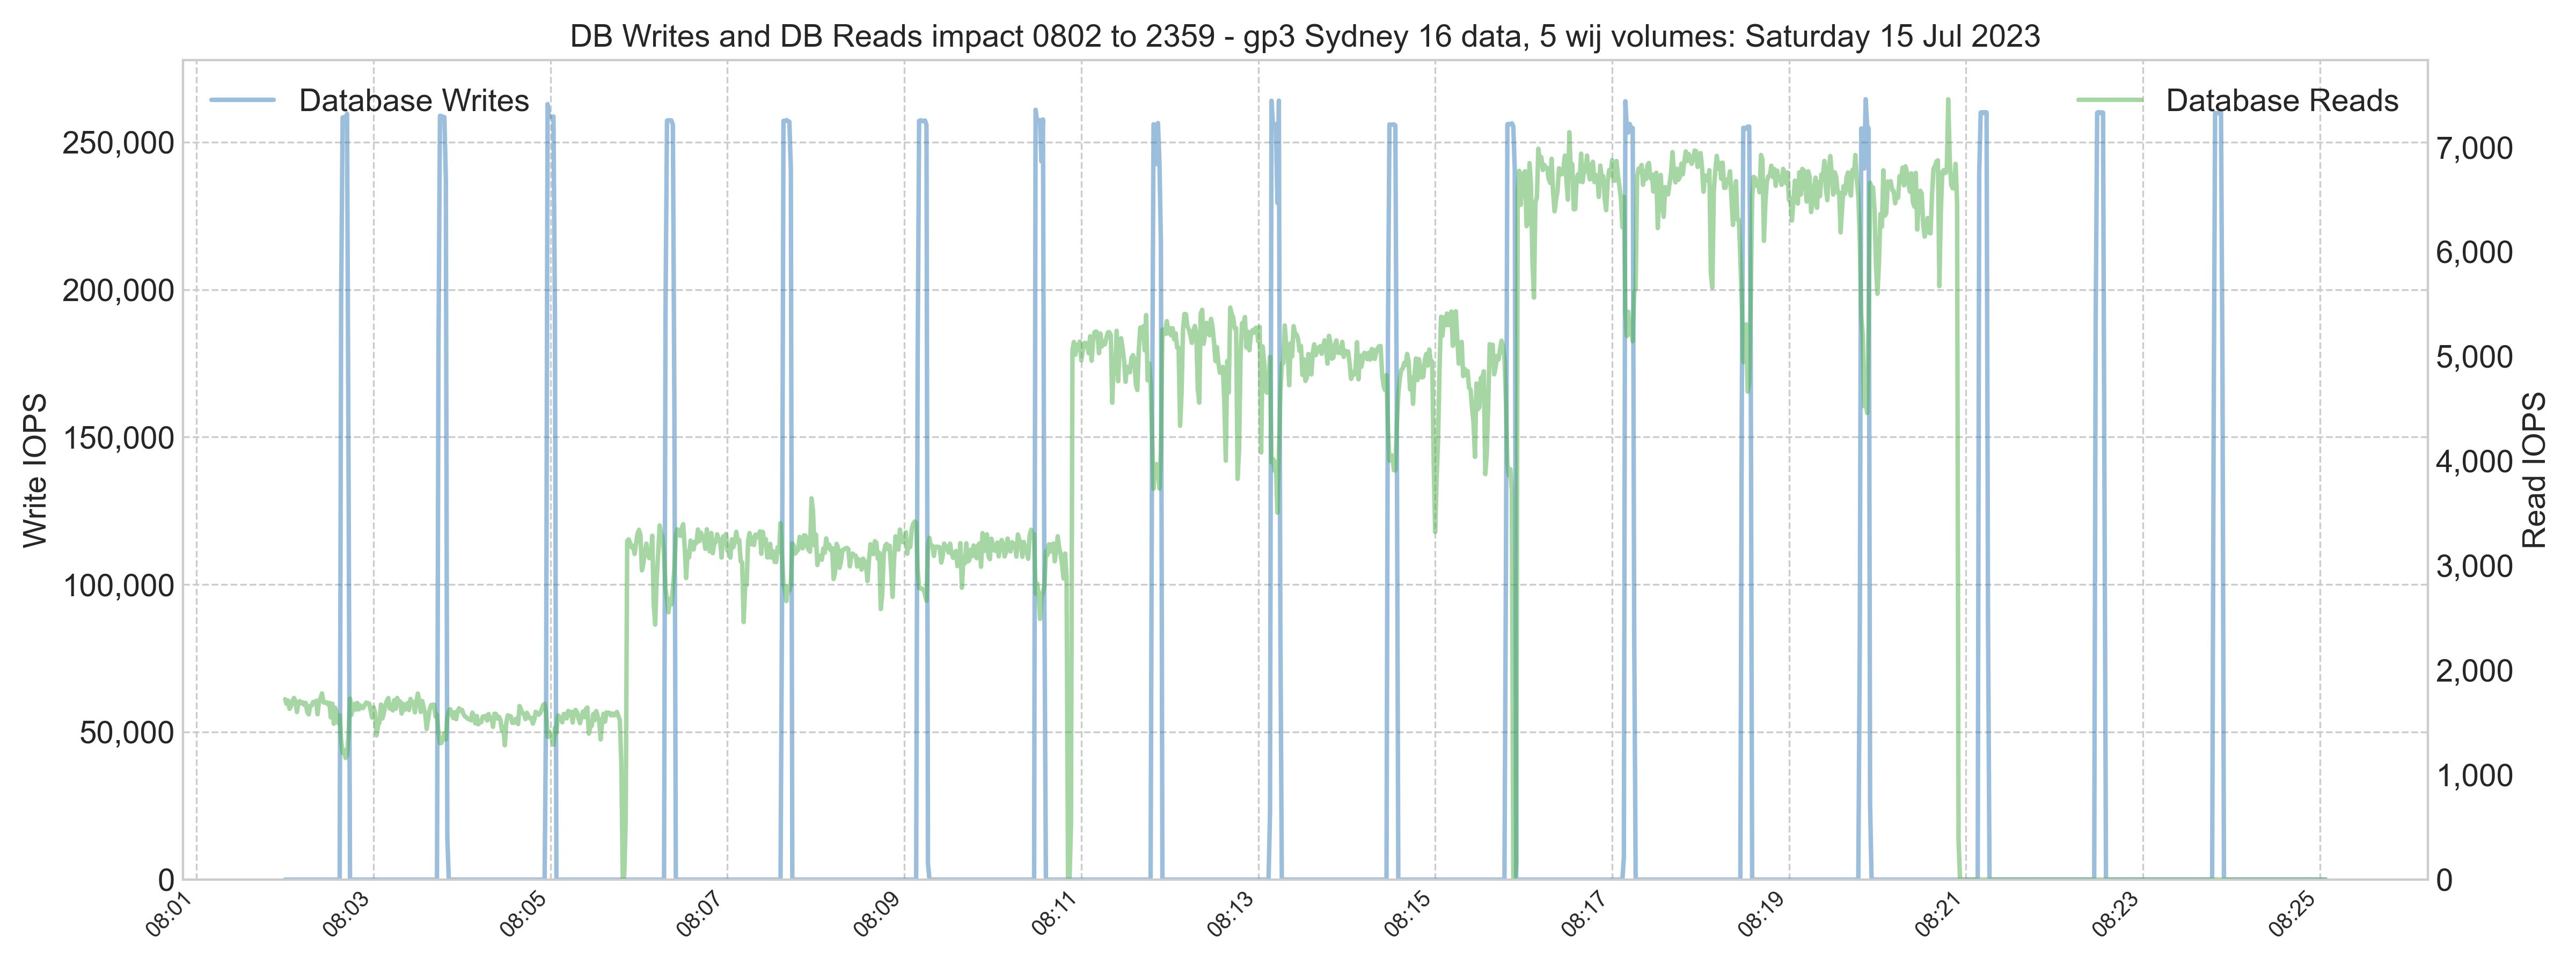
Compare the baseline read latency to the maximum latency for the different volume types.
Other details
IRIS Configuration
The IRIS version test was 2023.2.0.204.0
Minimal configuration was done for IRIS. A snippet of the cpf file is shown below.
[config]
Asyncwij=16
:
globals=0,0,589824,0,0,0
:
wdparm=16,32,512,128
wduseasyncio=1
- Asyncwij = 16 means 16 in flight, WIJ writes at a time. The default is eight.
The wdparm parameter is used to configure the number of slave write daemons, the size of the device ID table (used for assigning writes to WDs), the maximum number of outstanding writes across all WDs, and whether or not the database will adjust the number of allowed writes PER WD if some WDs are inactive or finish early on a given pass.
16 = Number of write daemons (8 is the default)
32 = Size of the device ID table (32 is the default)
512 = Max number of outstanding IOs for all write daemons
128 = Max number of outstanding IOs per write daemon
AWS AZ ping times on the day of the mirror test
The Primary mirror was in AZ b; the backup mirror was in AZ c.
- Ping AZ b to AZ c average 1.16ms
- Ping AZ c to AZ b average 1.12ms