InterSystems Business Intelligence enables you to embed business intelligence (BI) into your applications so that your users can ask and answer sophisticated questions of their data. Specifically, your application can include dashboards, which can include the following:
Interactive widgets that execute queries designed for specific user roles or for specific areas of your user interface.
Controls such as drop-down lists and data choosers that enable users to modify these queries.
Interactive drill options that enable users to view the displayed data in different ways.
Options to export, print, and send alerts to other users.
An option to launch the Mini Analyzer, which supports free-form analysis.
Execute custom actions that are provided as buttons or other controls.
In contrast to traditional BI systems that use static data warehouses, Business Intelligence is kept closely in synchronization with the live transactional data, as required for your business.
I built a dashboard to show hourly instrument capacities based on a term list. The term list consists of the TestInstrumentID and the number of tests that instrument can perform in 1 hour. The calculation works correctly and the data is accurate but periodically if you go to check the dashboard the percentages all get changed to 100% across every hour. If you check it later or add an additional site to the filter then the percentages correct themselves. I don't know what's causing this or how to troubleshoot it because it does calculate correctly but is not consistent.
I have a server with rusw locale but in my cube the time dimension shows dates such as "JAN-2018". Is there a way to either localize that (preferably) or just output numbers like "01-2018"?
Architect:
Analyzer:
Also in architect, in level settings there is a "Time Format" property, what's that? Tried setting it to 3 but it didn't help.
Using cube CubeA and cube CubeB that contains calculated measure TotalClients. I would like to use TotalClient calculated measure from a compound cube CubeC (CubeA,CubeB).
How do I best create a filter in DeepSee to restrict query results for the current login, that is where the results are filtered by a Dimension compared to the ObjectScript special variable $USERNAME or an ObjectScript expression that restricts what the current user is allowed to see?
Hi I am experienced with Ensemble but working in my first DeepSee project, so forgive me if this seems elementary.
My question is, how do I clear the data out? Every time I build I am adding more and more data. But I would like to revert my cube to being 0 so I can reload it and start over? Set my row count back to 0?
I am unable to remove/purge through the management portal
-I've tried to kill my cube Do ##class(%DeepSee.Utils).%KillCube("MyCube.Cube") and then Rebuild it.
I tried using the DeepSee Troubleshooting guide but the suggestions weren't working. Let's say that the source data we are using to build the cube on has a value out of range. This would cause the cube build/update to fail. How do I see the error log that explains which field has the value out of range? Please be detailed on exactly what command I should enter and where I should enter it in.
I'm using Git with DeepSee and when I need to do a commit to the git repo I'm exporting ALL the pivots and dashboards from the namespace. But I can forget to do that) And it can take time for a large system.
What is the way to manage automatical export of DeepSee artefacts which we are editing in UI (Cubes, Pivots, Dashboards, Pivot Variables, Term lists, Shared Measures) into files every time when I push Save button?
I have a dashboard which shows the growth of the months compared with the month from the last year.
The way I found to develop that, it was with a kpi. So, I overrode the %OnLoadKPI method with two mdx:
SELECT NON EMPTY [DataD].[H1].[MothYear].Members ON ROWS, [Measures].[CountVisits] ON COLUMNS FROM SubjectAtendimento %FILTER [DataD].[H1].[Year].&[2016]
SELECT NON EMPTY [DataD].[H1].[MonthYear].Members ON ROWS, [Measures].[CountVisits] ON COLUMNS FROM SubjectAtendimento %FILTER [DataD].[H1].[Year].&[2015]
We are currently developing a set of cubes in Unified Care Report (UCR) for data analysis purposes. However, we are encountering issues with cube dependencies, where certain cubes rely on others to be compiled beforehand. The complexity of these dependencies is becoming increasingly difficult to manage, particularly when attempting to deploy the cubes.
I have a cube with two dimensions, DimA and DimB, with the following structure:
DimA/H1/LevelA
DimA/H1/LevelC
DimB/H1/LevelB
DimB/H1/LevelC
LevelC is modeled in such way because its bound property (C) is group by properties A and B in transactional database, but A and B haven't relation.
I can use DeepSee REST API service /Info/FilterMembers/:datasource/:filterSpec specifying each dimension one filterSpec parameter and handle the results.
But, I would like to have the results for both dimension in only on service call.
I am programming a daily reporting that will send by e-mail when people will add a dashboard as favorite by clicking on the star :
I asked Intersystems WRC on how to automatically generate a report with some line coding, but I heard there is no way to do this without a headless Browser.
Suppose you have large set of cubes, pivots and dashboards in your DeepSee solution.
Then you change the level, measure or dimension in the cube and is there any way to test that your new input didn't break current pivots, dashboards, etc?
Hi hi, Is there any way to do an automated daily print-to-PDF of a dashboard (its' widgets / pivots etc)? I am able to add a "Print" Control to a Widget on a dashboard to do the default DeepSee Print functionality of a Control, but this is manual and browser dependent. Is there a way I can either: 1) have say a scheduled task to automatically print the dashboard (as and instead of the manual Control click) including specifying filename?
I have to create a pivot that shows the result comparing the last week of the current date with the last week of the last year in the same month. I tried using the function LAG, but didn´t work. Works only if I want to compare the months between the two years. If someone has some idea, i will appreciatte a lot.
I need to convert a JSON payload to a custom object type. Currently, I'm converting the JSON object to a %Library.DynamicObject object and need to proceed from here.
As of now, these are my options
1. Using an external library talked about in this link:
How do we return a member from a set? For example if I want a calculated measure to return the NAME of the date with the max transactions, to get the set ordered I might do something like:
But how do I access the first member in the set as a member so that I can get to the properties such as the member NAME (what I want to return in this case)?
In some MDX implementations like Microsoft there are kind of backdoor functions for this like:
 By replies
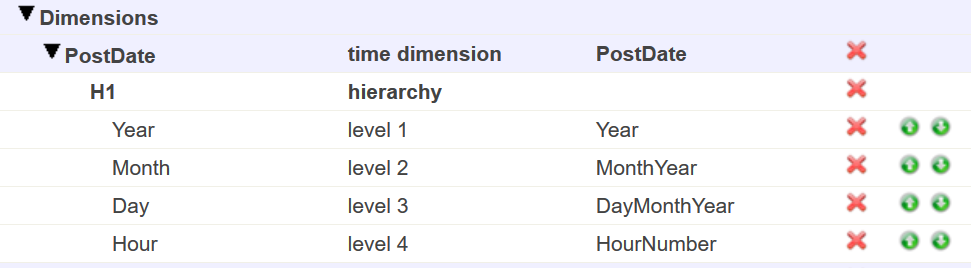
.png)